
使用 Vue.js 創建帶有 API 的交互式天氣儀表板
已發表: 2022-03-10(這是一篇贊助文章。)在本教程中,您將從頭開始構建一個簡單的天氣儀表板。 它將是一個客戶端應用程序,既不是“Hello World”示例,也不是其規模和復雜性太嚇人。
整個項目將使用來自 Node.js + npm 生態系統的工具進行開發。 特別是,我們將嚴重依賴 Dark Sky API 來處理數據,Vue.js 來處理所有繁重的工作,而 FusionCharts 來處理數據可視化。
先決條件
我們希望您熟悉以下內容:
- HTML5 和 CSS3 (我們還將使用 Bootstrap 提供的基本功能;
- JavaScript (尤其是 ES6 語言的使用方式);
- Node.js 和 npm (環境和包管理的基礎知識就好了)。
除了上面提到的之外,如果您熟悉Vue.js或任何其他類似的 JavaScript 框架,那就太好了。 我們不希望您了解FusionCharts — 它非常易於使用,您可以隨時學習!
預期學習
您從該項目中學到的主要知識將是:
- 如何計劃實施一個好的儀表板
- 如何使用 Vue.js 開發應用程序
- 如何創建數據驅動的應用程序
- 如何使用 FusionCharts 可視化數據
特別是,每個部分都讓您更接近學習目標:
- 天氣儀表板簡介
本章概述了工作的不同方面。 - 創建項目
在本節中,您將了解如何使用 Vue 命令行工具從頭開始創建項目。 - 自定義默認項目結構
您在上一節中獲得的默認項目腳手架是不夠的; 在這裡,您從結構的角度了解項目所需的其他內容。 - 數據採集和處理
這部分是項目的核心; 此處展示了從 API 獲取和處理數據的所有關鍵代碼。 期望在這部分花費最多的時間。 - 使用 FusionCharts 進行數據可視化
一旦我們穩定了項目的所有數據和其他移動部分,本節將致力於使用 FusionCharts 和一些 CSS 可視化數據。
1.儀表板工作流程
在我們深入實施之前,重要的是要清楚我們的計劃。 我們將計劃分為四個不同的方面:
要求
我們對這個項目有什麼要求? 換句話說,我們想通過 Weather Dashboard 展示哪些內容? 請記住,我們的目標受眾可能只是口味簡單的凡人,我們想向他們展示以下內容:
- 他們想要查看天氣的位置的詳細信息,以及有關天氣的一些主要信息。 由於沒有嚴格的要求,我們稍後會弄清楚無聊的細節。 但是,在這個階段,需要注意的是,我們必須為觀眾提供一個搜索框,以便他們可以提供他們感興趣的位置的輸入。
- 有關其感興趣位置的天氣的圖形信息,例如:
- 查詢當日溫度變化
- 今日天氣亮點:
- 風速和風向
- 能見度
- 紫外線指數
注意:從 API 獲得的數據提供了有關天氣的許多其他方面的信息。 為了將代碼保持在最低限度,我們選擇不使用所有這些。
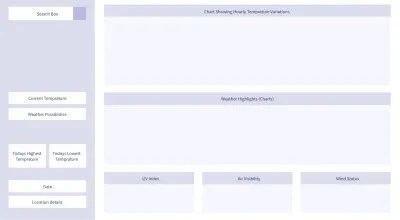
結構
根據需求,我們可以構建我們的儀表板,如下所示:
數據
我們的儀表板與我們獲得的數據一樣好,因為如果沒有適當的數據,就不會有漂亮的可視化。 有很多公共 API 可以提供天氣數據——其中一些是免費的,而另一些則不是。 對於我們的項目,我們將從 Dark Sky API 收集數據。 但是,我們將無法直接從客戶端輪詢 API 端點。 別擔心,我們有一個解決方法,會在適當的時候公佈! 一旦我們獲得搜索位置的數據,我們將進行一些數據處理和格式化——你知道,幫助我們支付賬單的技術類型。
可視化
一旦我們獲得乾淨且格式化的數據,我們將其插入 FusionCharts。 世界上很少有 JavaScript 庫能像 FusionCharts 一樣強大。 在 FusionCharts 提供的大量產品中,我們將只使用其中的一小部分——全部用 JavaScript 編寫,但在與 FusionCharts 的 Vue 包裝器集成時可以無縫工作。
有了更大的圖景,讓我們動手吧——是時候把事情具體化了! 在下一節中,您將創建基本的 Vue 項目,我們將在此基礎上進一步構建。
2. 創建項目
要創建項目,請執行以下步驟:
- 安裝 Node.js + npm
(如果您的計算機上安裝了 Node.js,請跳過此步驟。 )
Node.js 與 npm 捆綁在一起,因此您無需單獨安裝 npm。 根據操作系統,按照此處給出的說明下載並安裝 Node.js。
安裝後,最好驗證軟件是否正常工作,以及它們的版本是什麼。 要測試它,請打開命令行/終端並執行以下命令:node --version npm --version - 使用 npm 安裝包
啟動並運行 npm 後,執行以下命令來安裝我們項目所需的基本包。npm install -g vue@2 vue-cli@2 - 使用
vue-cli初始化項目腳手架
假設上一步一切順利,下一步就是使用vue-cli(來自 Vue.js 的命令行工具)來初始化項目。 為此,請執行以下操作: - 使用 webpack-simple 模板初始化腳手架。
你會被問到一堆問題——接受除了最後一個問題之外的所有問題的默認值對於這個項目來說已經足夠了; 最後一個回答vue init webpack-simple vue_weather_dashboardN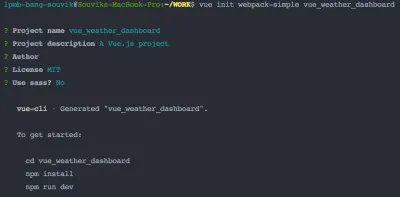
(大預覽) webpack-simple非常適合像我們這樣的快速原型設計和輕量級應用程序,但它並不特別適合嚴肅的應用程序或生產部署。 如果您想使用任何其他模板(儘管如果您是新手,我們會建議您不要這樣做),或者想將您的項目命名為其他名稱,語法為:vue init [template-name] [project-name] - 導航到 vue-cli 為項目創建的目錄。
cd vue_weather_dashboard - 安裝
package.json中提到的所有包,該包是由vue-cli工具為webpack-simple模板創建的。npm install - 啟動開發服務器並在瀏覽器中查看您的默認 Vue 項目!
npm run dev
如果您是 Vue.js 的新手,請花點時間細細品味您的最新成就——您已經創建了一個小型 Vue 應用程序,它在 localhost:8080 上運行!

默認項目結構的簡要說明
是時候看一下vue_weather_dashboard目錄裡面的結構了,這樣在我們開始修改之前你就可以了解基礎知識了。
結構看起來像這樣:
vue_weather_dashboard |--- README.md |--- node_modules/ | |--- ... | |--- ... | |--- [many npm packages we installed] | |--- ... | |--- ... |--- package.json |--- package-lock.json |--- webpack.config.js |--- index.html |--- src | |--- App.vue | |--- assets | | |--- logo.png | |--- main.js儘管跳過熟悉默認文件和目錄可能很誘人,但如果您是 Vue 新手,我們強烈建議您至少查看一下文件的內容。 這可能是一個很好的教育課程,並引發您應該自行解決的問題,尤其是以下文件:
-
package.json,看看它的表親package-lock.json -
webpack.config.js -
index.html -
src/main.js -
src/App.vue
樹形圖中顯示的每個文件和目錄的簡要說明如下:
- 自述文件.md
猜測沒有獎品——主要是讓人類閱讀和理解創建項目腳手架所需的步驟。 - 節點模塊/
這是 npm 下載啟動項目所需的包的目錄。package.json文件中提供了有關所需軟件包的信息。 - 包.json
該文件由 vue-cli 工具根據webpack-simple模板的要求創建,並包含有關必須安裝的 npm 包的信息(包括其版本和其他詳細信息)。 仔細看看這個文件的內容——這是你應該訪問的地方,也許可以編輯添加/刪除項目所需的包,然後運行 npm install。 在此處閱讀有關package.json的更多信息。 - 包-lock.json
該文件由 npm 自己創建,主要用於記錄 npm 下載和安裝的內容。 - webpack.config.js
這是一個包含 webpack 配置的 JavaScript 文件——一個將我們項目的不同方面(代碼、靜態資產、配置、環境、使用模式等)捆綁在一起的工具,並在將其提供給用戶之前進行壓縮。 好處是所有東西都自動綁定在一起,並且由於應用程序性能的提高(頁面服務迅速並且在瀏覽器上加載速度更快),用戶體驗大大增強。 正如您稍後可能會遇到的那樣,當構建系統中的某些內容無法按預期方式運行時,需要檢查該文件。 此外,當您要部署應用程序時,這是需要編輯的關鍵文件之一(在此處閱讀更多內容)。 - 索引.html
這個 HTML 文件充當矩陣(或者你可以說,模板),數據和代碼將在其中動態嵌入(這是 Vue 主要做的),然後提供給用戶。 - src/main.js
這個 JavaScript 文件包含主要管理頂級/項目級依賴關係的代碼,並定義了最頂級的 Vue 組件。 簡而言之,它為整個項目編排了 JavaScript,並作為應用程序的入口點。 當您需要在某些節點模塊上聲明項目範圍的依賴項時,請編輯此文件,或者您希望更改項目中最頂層的 Vue 組件的某些內容。 - src/App.vue
在前一點中,當我們談論“最頂層的 Vue 組件”時,我們實質上是在談論這個文件。 項目中的每個 .vue 文件都是一個組件,組件是層次相關的。 一開始,我們只有一個.vue文件,即App.vue,作為我們唯一的組件。 但很快我們將向我們的項目添加更多組件(主要遵循儀表板的結構),並根據我們想要的層次結構鏈接它們,App.vue 是所有組件的祖先。 這些.vue文件將包含 Vue 希望我們編寫的格式的代碼。 別擔心,它們是編寫的 JavaScript 代碼,維護一個可以讓我們保持理智和有條理的結構。 你已經被警告了——在這個項目結束時,如果你是 Vue 的新手,你可能會沉迷於template — script — styletemplate — script — styletemplate — script — style組織代碼的方式!
現在我們已經創建了基礎,是時候:
- 修改模板並稍微調整配置文件,以便項目按照我們想要的方式運行。
- 創建新的
.vue文件,並使用 Vue 代碼實現儀表板結構。
我們將在下一節中學習它們,這會有點長,需要注意。 如果您需要咖啡因或水,或者想要排便——現在正是時候!
3.自定義默認項目結構
是時候修補腳手架項目給我們的基礎了。 在開始之前,請確保webpack提供的開發服務器正在運行。 連續運行此服務器的優勢在於,您對源代碼所做的任何更改(保存並刷新網頁)都會立即反映在瀏覽器上。
如果要啟動開發服務器,只需從終端執行以下命令(假設您的當前目錄是項目目錄):
npm run dev在以下部分中,我們將修改一些現有文件,並添加一些新文件。 隨後將簡要說明這些文件的內容,以便您了解這些更改的含義。
修改現有文件
索引.html
我們的應用程序實際上是一個單頁應用程序,因為只有一個網頁會顯示在瀏覽器上。 我們稍後會討論這個,但首先讓我們進行第一個更改——更改<title>標記中的文本。
通過這個小修訂,HTML 文件如下所示:
<!DOCTYPE html> <html lang="en"> <head> <meta charset="utf-8"> <!-- Modify the text of the title tag below --> <title>Vue Weather Dashboard</title> </head> <body> <div></div> <script src="/dist/build.js"></script> </body> </html> 花點時間在localhost:8080刷新網頁,然後在瀏覽器選項卡的標題欄上看到變化——它應該顯示“Vue Weather Dashboard”。 但是,這只是為了向您展示進行更改並驗證其是否正常工作的過程。 我們還有更多事情要做!
這個簡單的 HTML 頁面缺少我們項目中需要的許多東西,尤其是以下內容:
- 一些元信息
- CDN 鏈接到 Bootstrap(CSS 框架)
- 鏈接到自定義樣式表(尚未添加到項目中)
-
<script>標籤中指向 Google Maps Geolocation API 的指針
添加這些東西之後,最終的index.html有以下內容:
<!DOCTYPE html> <html lang="en"> <head> <meta http-equiv="Content-Type" content="text/html;charset=utf-8" /> <meta http-equiv="X-UA-Compatible" content="IE=edge"> <meta name="viewport" content="width=device-width, initial-scale=1, shrink-to-fit=no"> <link rel="stylesheet" href="//maxcdn.bootstrapcdn.com/bootstrap/4.0.0/css/bootstrap.min.css"> <link rel="stylesheet" type="text/css" href="src/css/style.css"> <title>Weather Dashboard</title> <script src="https://maps.googleapis.com/maps/api/js?key=AIzaSyC-lCjpg1xbw-nsCc11Si8Ldg2LKYizqI4&libraries=places"></script> </head> <body> <div></div> <script src="/dist/build.js"></script> </body> </html>保存文件,然後刷新網頁。 您可能已經註意到頁面加載時有輕微的顛簸——這主要是因為頁面樣式現在由 Bootstrap 控制,並且字體、間距等樣式元素與我們的默認值不同較早(如果您不確定,請回滾到默認值並查看差異)。

注意:在我們繼續之前有一件重要的事情——Google Maps API 的 URL 包含一個密鑰,它是 FusionCharts 的一個屬性。 現在,您可以使用此密鑰來構建項目,因為我們不希望您被這些類型的微小細節所困擾(當您是新手時,這可能會分散您的注意力)。 但是,我們強烈建議您在取得一些進展並願意關注這些微小細節後,生成並使用自己的 Google Maps API 密鑰。
包.json
在撰寫本文時,我們為我們的項目使用了某些版本的 npm 包,我們確信這些東西可以協同工作。 但是,當您執行項目時,npm 為您下載的最新穩定版本的軟件包很可能與我們使用的不同,這可能會破壞代碼(或做超出我們的控制)。 因此,擁有用於構建此項目的完全相同的package.json文件非常重要,這樣我們的代碼/解釋和您得到的結果是一致的。
package.json文件的內容應該是:
{ "name": "vue_weather_dashboard", "description": "A Vue.js project", "version": "1.0.0", "author": "FusionCharts", "license": "MIT", "private": true, "scripts": { "dev": "cross-env NODE_ENV=development webpack-dev-server --open --hot", "build": "cross-env NODE_ENV=production webpack --progress --hide-modules" }, "dependencies": { "axios": "^0.18.0", "babel": "^6.23.0", "babel-cli": "^6.26.0", "babel-polyfill": "^6.26.0", "fusioncharts": "^3.13.3", "moment": "^2.22.2", "moment-timezone": "^0.5.21", "vue": "^2.5.11", "vue-fusioncharts": "^2.0.4" }, "browserslist": [ "> 1%", "last 2 versions", "not ie <= 8" ], "devDependencies": { "babel-core": "^6.26.0", "babel-loader": "^7.1.2", "babel-preset-env": "^1.6.0", "babel-preset-stage-3": "^6.24.1", "cross-env": "^5.0.5", "css-loader": "^0.28.7", "file-loader": "^1.1.4", "vue-loader": "^13.0.5", "vue-template-compiler": "^2.4.4", "webpack": "^3.6.0", "webpack-dev-server": "^2.9.1" } } 我們鼓勵您瀏覽新的package.json ,並找出 json 中不同對象的功能。 您可能更喜歡將“ author ”鍵的值更改為您的姓名。 此外,依賴項中提到的包將在代碼中的正確時間顯示出來。 暫時,知道以下就足夠了:
-
babel相關的包用於正確處理瀏覽器的 ES6 樣式代碼; -
axios處理基於 Promise 的 HTTP 請求; -
moment和 moment-timezone 用於日期/時間操作; -
fusioncharts和vue-fusioncharts負責渲染圖表: -
vue,原因很明顯。
webpack.config.js
與package.json一樣,我們建議您維護一個與我們用於構建項目的文件一致的webpack.config.js文件。 但是,在進行任何更改之前,我們建議您仔細比較webpack.config.js中的默認代碼和我們在下面提供的代碼。 你會注意到很多不同之處——用谷歌搜索它們並對它們的含義有一個基本的了解。 由於深入解釋 webpack 配置超出了本文的範圍,因此在這方面您只能靠自己。
自定義的webpack.config.js文件如下:
var path = require('path') var webpack = require('webpack') module.exports = { entry: ['babel-polyfill', './src/main.js'], output: { path: path.resolve(__dirname, './dist'), publicPath: '/dist/', filename: 'build.js' }, module: { rules: [ { test: /\.css$/, use: [ 'vue-style-loader', 'css-loader' ], }, { test: /\.vue$/, loader: 'vue-loader', options: { loaders: { } // other vue-loader options go here } }, { test: /\.js$/, loader: 'babel-loader', exclude: /node_modules/ }, { test: /\.(png|jpg|gif|svg)$/, loader: 'file-loader', options: { name: '[name].[ext]?[hash]' } } ] }, resolve: { alias: { 'vue$': 'vue/dist/vue.esm.js' }, extensions: ['*', '.js', '.vue', '.json'] }, devServer: { historyApiFallback: true, noInfo: true, overlay: true, host: '0.0.0.0', port: 8080 }, performance: { hints: false }, devtool: '#eval-source-map' } if (process.env.NODE_ENV === 'production') { module.exports.devtool = '#source-map' // https://vue-loader.vuejs.org/en/workflow/production.html module.exports.plugins = (module.exports.plugins || []).concat([ new webpack.DefinePlugin({ 'process.env': { NODE_ENV: '"production"' } }), new webpack.optimize.UglifyJsPlugin({ sourceMap: true, compress: { warnings: false } }), new webpack.LoaderOptionsPlugin({ minimize: true }) ]) } 對項目的webpack.config.js進行更改後,必須停止正在運行的開發服務器( Ctrl + C ),並在安裝包中提到的所有package.json後使用從項目目錄執行的以下命令重新啟動它package.json文件:
npm install npm run dev有了這個,調整配置和確保正確的包就位的折磨就結束了。 不過,這也標誌著修改和編寫代碼的旅程,有點長,但也很有收穫!
src/main.js
這個文件是項目頂層編排的關鍵——我們在這裡定義:
- 什麼是頂級依賴項(從哪裡獲得最重要的 npm 包);
- 如何解決依賴關係,以及 Vue 使用插件/包裝器的說明(如果有);
- 管理項目中最頂層組件的 Vue 實例:
src/App.vue(節點.vue文件)。
根據我們對src/main.js文件的目標,代碼應該是:
// Import the dependencies and necessary modules import Vue from 'vue'; import App from './App.vue'; import FusionCharts from 'fusioncharts'; import Charts from 'fusioncharts/fusioncharts.charts'; import Widgets from 'fusioncharts/fusioncharts.widgets'; import PowerCharts from 'fusioncharts/fusioncharts.powercharts'; import FusionTheme from 'fusioncharts/themes/fusioncharts.theme.fusion'; import VueFusionCharts from 'vue-fusioncharts'; // Resolve the dependencies Charts(FusionCharts); PowerCharts(FusionCharts); Widgets(FusionCharts); FusionTheme(FusionCharts); // Globally register the components for project-wide use Vue.use(VueFusionCharts, FusionCharts); // Instantiate the Vue instance that controls the application new Vue({ el: '#app', render: h => h(App) })src/App.vue
這是整個項目中最重要的文件之一,它代表了層次結構中最頂層的組件——整個應用程序本身。 對於我們的項目,這個組件將完成所有繁重的工作,我們將在後面進行探討。 現在,我們想擺脫默認的樣板,並加入我們自己的東西。
如果您不熟悉 Vue 組織代碼的方式,最好了解.vue文件中的一般結構。 .vue文件包含三個部分:
- 模板
這是定義頁面的 HTML 模板的地方。 除了靜態 HTML,本節還包含 Vue 使用雙花括號{{ }}嵌入動態內容的方式。 - 腳本
JavaScript 統治這一部分,並負責生成動態內容,這些內容在 HTML 模板中的適當位置出現和放置。 此部分主要是一個導出的對象,包括:- 數據
這本身就是一個函數,通常它會返回一些封裝在一個不錯的數據結構中的所需數據。 - 方法
由一個或多個函數/方法組成的對象,每個函數/方法通常以某種方式操作數據,並且還控制 HTML 模板的動態內容。 - 計算
很像上面討論的方法對象,但有一個重要區別——雖然方法對像中的所有函數在任何一個被調用時都會執行,但計算對像中的函數表現得更加明智,並且僅當它被調用時才會執行。叫。
- 數據
- 風格
本節介紹適用於頁面 HTML 的 CSS 樣式(在模板中編寫)——將好的舊 CSS 放在這里以使您的頁面更漂亮!
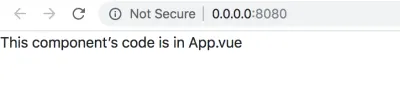
牢記上述範式,讓我們對App.vue中的代碼進行最低限度的定制:
<template> <div> <p>This component's code is in {{ filename }}</p> </div> </template> <script> export default { data() { return { filename: 'App.vue' } }, methods: { }, computed: { }, } </script> <style> </style> 請記住,上面的代碼片段只是為了測試App.vue是否正在使用我們自己的代碼。 它稍後會進行很多更改,但首先保存文件並在瀏覽器上刷新頁面。
此時,在工具方面獲得一些幫助可能是個好主意。 查看適用於 Chrome 的 Vue devtools,如果您在使用 Google Chrome 作為默認瀏覽器進行開發時沒有太多問題,請安裝該工具並嘗試一下。 當事情變得更加複雜時,它將非常方便地進行進一步的開發和調試。
其他目錄和文件
下一步是添加其他文件,以便我們的項目結構變得完整。 我們將添加以下目錄和文件:
-
src/css/—style.css -
src/assets/——calendar.svg——vlocation.svg——search.svg——winddirection.svg——windspeed.svg -
src/components/——Content.vue——Highlights.vue——TempVarChart.vue——UVIndex.vue——Visibility.vue——WindStatus.vue
注意:將超鏈接的.svg文件保存在您的項目中。
創建上面提到的目錄和文件。 最終的項目結構應該看起來像(記住從默認結構中刪除現在不需要的文件夾和文件):
vue_weather_dashboard/ |--- README.md |--- node_modules/ | |--- ... | |--- ... | |--- [many npm packages we installed] | |--- ... | |--- ... |--- package.json |--- package-lock.json |--- webpack.config.js |--- index.html |--- src/ | |--- App.vue | |--- css/ | | |--- style.css | |--- assets/ | | |--- calendar.svg | | |--- location.svg | | |--- location.svg | | |--- winddirection.svg | | |--- windspeed.svg | |--- main.js | |--- components/ | | |--- Content.vue | | |--- Highlights.vue | | |--- TempVarChart.vue | | |--- UVIndex.vue | | |--- Visibility.vue | | |--- WindStatus.vue 項目的根文件夾中可能還有一些其他文件,例如.babelrc 、 .gitignore 、 .editorconfig等。 您現在可以安全地忽略它們。
在下一節中,我們將對新添加的文件添加最少的內容,並測試它們是否正常工作。
src/css/style.css
雖然它不會立即有多大用處,但將以下代碼複製到文件中:
@import url("https://fonts.googleapis.com/css?family=Roboto:300,400,500"); :root { font-size: 62.5%; } body { font-family: Roboto; font-weight: 400; width: 100%; margin: 0; font-size: 1.6rem; } #sidebar { position: relative; display: flex; flex-direction: column; background-image: linear-gradient(-180deg, #80b6db 0%, #7da7e2 100%); } #search { text-align: center; height: 20vh; position: relative; } #location-input { height: 42px; width: 100%; opacity: 1; border: 0; border-radius: 2px; background-color: rgba(255, 255, 255, 0.2); margin-top: 16px; padding-left: 16px; color: #ffffff; font-size: 1.8rem; line-height: 21px; } #location-input:focus { outline: none; } ::placeholder { color: #FFFFFF; opacity: 0.6; } #current-weather { color: #ffffff; font-size: 8rem; line-height: 106px; position: relative; } #current-weather>span { color: #ffffff; font-size: 3.6rem; line-height: 42px; vertical-align: super; opacity: 0.8; top: 15px; position: absolute; } #weather-desc { font-size: 2.0rem; color: #ffffff; font-weight: 500; line-height: 24px; } #possibility { color: #ffffff; font-size: 16px; font-weight: 500; line-height: 19px; } #max-detail, #min-detail { color: #ffffff; font-size: 2.0rem; font-weight: 500; line-height: 24px; } #max-detail>i, #min-detail>i { font-style: normal; height: 13.27px; width: 16.5px; opacity: 0.4; } #max-detail>span, #min-detail>span { color: #ffffff; font-family: Roboto; font-size: 1.2rem; line-height: 10px; vertical-align: super; } #max-summary, #min-summary { opacity: 0.9; color: #ffffff; font-size: 1.4rem; line-height: 16px; margin-top: 2px; opacity: 0.7; } #search-btn { position: absolute; right: 0; top: 16px; padding: 2px; z-index: 999; height: 42px; width: 45px; background-color: rgba(255, 255, 255, 0.2); border: none; } #dashboard-content { text-align: center; height: 100vh; } #date-desc, #location-desc { color: #ffffff; font-size: 1.6rem; font-weight: 500; line-height: 19px; margin-bottom: 15px; } #date-desc>img { top: -3px; position: relative; margin-right: 10px; } #location-desc>img { top: -3px; position: relative; margin-left: 5px; margin-right: 15px; } #location-detail { opacity: 0.7; color: #ffffff; font-size: 1.4rem; line-height: 20px; margin-left: 35px; } .centered { position: fixed; top: 45%; left: 50%; transform: translate(-50%, -50%); } .max-desc { width: 80px; float: left; margin-right: 28px; } .temp-max-min { margin-top: 40px } #dashboard-content { background-color: #F7F7F7; } .custom-card { background-color: #FFFFFF !important; border: 0 !important; margin-top: 16px !important; margin-bottom: 20px !important; } .custom-content-card { background-color: #FFFFFF !important; border: 0 !important; margin-top: 16px !important; margin-bottom: 0px !important; } .header-card { height: 50vh; } .content-card { height: 43vh; } .card-divider { margin-top: 0; } .content-header { color: #8786A4; font-size: 1.4rem; line-height: 16px; font-weight: 500; padding: 15px 10px 5px 15px; } .highlights-item { min-height: 37vh; max-height: 38vh; background-color: #FFFFFF; } .card-heading { color: rgb(33, 34, 68); font-size: 1.8rem; font-weight: 500; line-height: 21px; text-align: center; } .card-sub-heading { color: #73748C; font-size: 1.6rem; line-height: 19px; } .card-value { color: #000000; font-size: 1.8rem; line-height: 21px; } span text { font-weight: 500 !important; } hr { padding-top: 1.5px; padding-bottom: 1px; margin-bottom: 0; margin-top: 0; line-height: 0.5px; } @media only screen and (min-width: 768px) { #sidebar { height: 100vh; } #info { position: fixed; bottom: 50px; width: 100%; padding-left: 15px; } .wrapper-right { margin-top: 80px; } } @media only screen and (min-width:1440px) { #sidebar { width: 350px; max-width: 350px; flex: auto; } #dashboard-content { width: calc(100% — 350px); max-width: calc(100% — 350px); flex: auto; } }源/資產/
在此目錄中,下載並保存下面提到的.svg文件:
-
calendar.svg -
location.svg -
search.svg -
winddirection.svg -
windspeed.svg
src/components/Content.vue
這就是我們所說的“啞組件”(即佔位符),它只是為了維護層次結構,本質上將數據傳遞給它的子組件。
請記住,在App.vue文件中編寫我們所有的代碼沒有技術門檻,但我們採用通過嵌套組件來拆分代碼的方法有兩個原因:
- 編寫乾淨的代碼,這有助於可讀性和可維護性;
- 複製我們將在屏幕上看到的相同結構,即層次結構。
在我們將Content.vue中定義的組件嵌套在根組件App.vue中之前,讓我們為Content.vue編寫一些玩具(但具有教育意義)代碼:
<template> <div> <p>This child components of Content.vue are:</p> <ul> <li v-for="child in childComponents">{{ child }}</li> </ul> </div> </template> <script> export default { data () { return { childComponents: ['TempVarChart.vue', 'Highlights.vue'] } }, methods: { }, computed: { }, } </script> <style> </style>在代碼中,仔細觀察並理解以下內容:
- 在
<script>標記中(我們顯然在其中編寫了一些 JavaScript 代碼),我們定義了一個默認導出的對象(使其可用於其他文件)。 該對象包含一個函數data(),它返回一個名為childComponents的數組對象,其元素是應該進一步嵌套的組件文件的名稱。 - 在
<template>標記(我們在其中編寫一些 HTML 模板)中,感興趣的是<ul>。- 在無序列表中,每個列表項都應該是預期子組件的名稱,如數組對象
childComponents中所定義。 此外,列表應該自動擴展到數組的最後一個元素。 似乎我們應該寫一個for循環,不是嗎? 我們通過使用 Vue.js 提供的v-for指令來做到這一點。v-for指令:- 作為
<li>標記的一個屬性,遍歷數組,呈現子組件的名稱,其中在{{ }}括號中提到了迭代器(我們在其中編寫列表項的文本)。
- 作為
- 在無序列表中,每個列表項都應該是預期子組件的名稱,如數組對象
上面的代碼和解釋構成了你後續理解腳本和模板是如何相互關聯的,以及我們如何使用 Vue.js 提供的指令的基礎。
我們已經學到了很多東西,但即使在所有這些之後,我們還有一件事要學習如何在層次結構中無縫連接組件——將數據從父組件向下傳遞給它的子組件。 現在,我們需要學習如何將一些數據從src/App.vue到src/components/Content.vue ,以便我們可以在這個項目中的其餘組件嵌套中使用相同的技術。
從父組件流向子組件的數據可能聽起來很簡單,但魔鬼在細節中! 正如下面簡要說明的那樣,使其工作涉及多個步驟:
- 定義和數據
現在,我們希望使用一些靜態數據——一個包含有關天氣不同方面的硬編碼值的對象就可以了! 我們創建了一個名為weather_data的對象,並從App.vue的data()函數中返回它。weather_data對像在下面的代碼段中給出:
weather_data: { location: "California", temperature: { current: "35 C", }, highlights: { uvindex: "3", windstatus: { speed: "20 km/h", direction: "NE", }, visibility: "12 km", }, },- 從父級傳遞數據
要傳遞數據,我們需要一個要發送數據的目的地! 在這種情況下,目的地是Content.vue組件,實現它的方式是:- 將
weather_data對象分配給<Content>標記的自定義屬性 - 使用 Vue.js 提供的
v-bind指令將屬性與數據綁定,該指令使屬性值動態化(響應原始數據中所做的更改)。<Content v-bind:weather_data=“weather_data”></Content>
- 將
定義和傳遞數據是在握手的源端處理的,在我們的例子中是App.vue文件。
App.vue文件的代碼,在其當前狀態下,如下所示:
<template> <div> <p>This component's code is in {{ filename }}</p> <Content v-bind:weather_data="weather_data"></Content> </div> </template> <script> import Content from './components/Content.vue' export default { name: 'app', components: { 'Content': Content }, data () { return { filename: 'App.vue', weather_data: { location: "California", temperature: { current: "35 C", }, highlights: { uvindex: "3", windstatus: { speed: "20 km/h", direction: "NE", }, visibility: "12 km", }, }, } }, methods: { }, computed: { }, } </script> <style> </style> 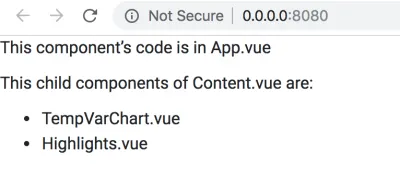
從源(父組件)定義和傳遞數據後,現在孩子有責任接收數據並適當地呈現它,如以下兩個步驟所述。
- 孩子接收數據
子組件,在本例中為Content.vue,必須接收父組件App.vue發送給它的weather_data對象。 Vue.js 提供了一種機制來做到這一點——你所需要的只是一個名為props的數組對象,它定義在Content.vue導出的默認對像中。 數組props的每個元素都是它想要從其父級接收的數據對象的名稱。 目前,它應該接收的唯一數據對像是來自 App.vue 的weather_data。 因此,props數組如下所示:
<template> // HTML template code here </template> <script> export default { props: ["weather_data"], data () { return { // data here } }, } </script> <style> // component specific CSS here </style>- 渲染頁面中的數據
現在我們已經確保接收到數據,我們需要完成的最後一個任務是渲染數據。 對於這個例子,我們將直接將接收到的數據轉儲到網頁上,只是為了說明該技術。 然而,在實際應用程序中(比如我們即將構建的應用程序),數據通常會經過大量處理,並且只有數據的相關部分以適合目的的方式顯示。 例如,在這個項目中,我們最終將從天氣 API 獲取原始數據,對其進行清理和格式化,將數據提供給圖表所需的數據結構,然後將其可視化。 無論如何,為了顯示原始數據轉儲,我們將只使用 Vue 可以理解的{{ }}括號,如下面的代碼片段所示:
<template> <div> // other template code here {{ weather_data }} </div> </template> 現在是時候吸收所有的點點滴滴了。 Content.vue的代碼——在它的當前狀態下——如下所示:
<template> <div> <p>This child components of Content.vue are:</p> <ul> <li v-for="child in childComponents">{{ child }}</li> </ul> {{ weather_data }} </div> </template> <script> export default { props: ["weather_data"], data () { return { childComponents: ['TempVarChart.vue', 'Highlights.vue'] } }, methods: { }, computed: { }, } </script> <style> #pagecontent { border: 1px solid black; padding: 2px; } </style> 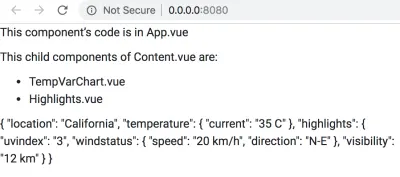
進行上述更改後,在瀏覽器上刷新網頁並查看其外觀。 花點時間欣賞一下 Vue 處理的複雜性——如果你修改App.vue中的weather_data對象,它會默默地傳送到Content.vue ,並最終傳送到顯示網頁的瀏覽器! 嘗試更改密鑰位置的值。
雖然我們已經了解了使用靜態數據的道具和數據綁定,但我們將在應用程序中使用通過 Web API 收集的動態數據,並將相應地更改代碼。
概括
在我們繼續討論其餘的.vue文件之前,讓我們總結一下我們在為App.vue和components/Content.vue編寫代碼時所學到的知識:
-
App.vue文件就是我們所說的根組件——它位於組件層次結構的頂部。.vue文件的其餘部分錶示作為其直接子代、孫代等的組件。 -
Content.vue文件是一個虛擬組件——它的職責是將數據傳遞到下面的級別並維護結構層次結構,以便我們的代碼與“*所見即所得*”的理念保持一致。 - 組件的父子關係不是憑空發生的——你必須註冊一個組件(全局或本地,取決於組件的預期用途),然後使用自定義 HTML 標籤嵌套它(其拼寫是準確的與註冊組件的名稱相同)。
- 一旦註冊和嵌套,數據就會從父組件傳遞到子組件,並且流程永遠不會反向(如果項目架構允許回流,就會發生不好的事情)。 父組件是數據的相對來源,它使用自定義 HTML 元素屬性的
v-bind指令將相關數據傳遞給其子組件。 孩子使用道具接收預期的數據,然後自行決定如何處理數據。
對於其餘的組件,我們將不做詳細解釋——我們將根據上述總結中的經驗編寫代碼。 代碼是不言而喻的,如果您對層次結構感到困惑,請參閱下圖:
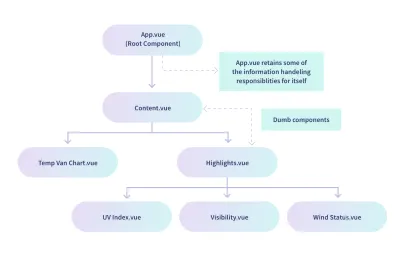
該圖表明TempVarChart.vue和Highlights.vue是Content.vue的直接子級。 因此,準備Content.vue以將數據發送到這些組件可能是一個好主意,我們使用以下代碼執行此操作:
<template> <div> <p>This child components of Content.vue are:</p> <ul> <li v-for="child in childComponents">{{ child }}</li> </ul> {{ weather_data }} <temp-var-chart :tempVar="tempVar"></temp-var-chart> <today-highlights :highlights="highlights"></today-highlights> </div> </template> <script> import TempVarChart from './TempVarChart.vue' import Highlights from './Highlights.vue' export default { props: ["weather_data"], components: { 'temp-var-chart': TempVarChart, 'today-highlights': Highlights }, data () { return { childComponents: ['TempVarChart.vue', 'Highlights.vue'], tempVar: this.weather_data.temperature, highlights: this.weather_data.highlights, } }, methods: { }, computed: { }, } </script> <style> </style> 保存此代碼後,您將收到錯誤 - 不用擔心,這是意料之中的。 一旦您準備好其餘的組件文件,它將被修復。 如果您無法看到輸出,請註釋掉包含自定義元素標籤<temp-var-chart>和<today-highlights> 。
對於本節,這是Content.vue的最終代碼。 對於本節的其餘部分,我們將參考此代碼,而不是我們為學習而編寫的之前的代碼。
src/components/TempVarChart.vue
其父組件Content.vue傳遞數據,必須設置TempVarChart.vue來接收和渲染數據,如下代碼所示:
<template> <div> <p>Temperature Information:</p> {{ tempVar }} </div> </template> <script> export default { props: ["tempVar"], data () { return { } }, methods: { }, computed: { }, } </script> <style> </style>src/components/Highlights.vue
該組件還將從App.vue (其父組件)接收數據。 之後,它應該與其子組件鏈接,並將相關數據傳遞給它們。
我們先來看從父節點接收數據的代碼:
<template> <div> <p>Weather Highlights:</p> {{ highlights }} </div> </template> <script> export default { props: ["highlights"], data () { return { } }, methods: { }, computed: { }, } </script> <style> </style>此時,網頁如下圖所示:
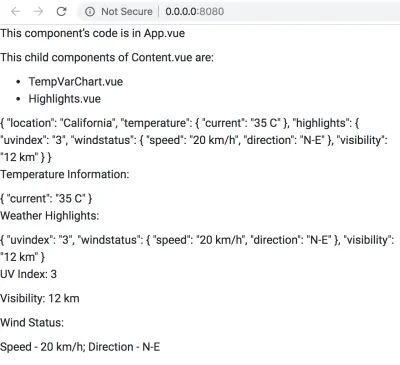
現在我們需要修改Highlights.vue的代碼來註冊和嵌套它的子組件,然後將數據傳遞給子組件。 它的代碼如下:
<template> <div> <p>Weather Highlights:</p> {{ highlights }} <uv-index :highlights="highlights"></uv-index> <visibility :highlights="highlights"></visibility> <wind-status :highlights="highlights"></wind-status> </div> </template> <script> import UVIndex from './UVIndex.vue'; import Visibility from './Visibility.vue'; import WindStatus from './WindStatus.vue'; export default { props: ["highlights"], components: { 'uv-index': UVIndex, 'visibility': Visibility, 'wind-status': WindStatus, }, data () { return { } }, methods: { }, computed: { }, } </script> <style> </style> 保存代碼並查看網頁後,您應該會在瀏覽器提供的開發者控制台工具中看到錯誤; 它們出現是因為儘管Highlights.vue正在發送數據,但沒有人接收它們。 我們還沒有為Highlights.vue的孩子編寫代碼。
請注意,我們沒有做太多的數據處理,即,我們沒有提取儀表板“亮點”部分下的天氣數據的各個因素。 我們可以在data()函數中做到這一點,但我們更喜歡讓Highlights.vue成為一個愚蠢的組件,它只是將它接收到的整個數據轉儲傳遞給每個孩子,然後他們擁有自己的提取物對他們來說是必要的. 但是,我們鼓勵您嘗試在Highlights.vue中提取數據,並將相關數據發送到每個子組件——儘管如此,這是一個很好的練習練習!
src/components/UVIndex.vue
該組件的代碼從Highlights.vue接收高光的數據轉儲,提取 UV Index 的數據,並將其呈現在頁面上。
<template> <div> <p>UV Index: {{ uvindex }}</p> </div> </template> <script> export default { props: ["highlights"], data () { return { uvindex: this.highlights.uvindex } }, methods: { }, computed: { }, } </script> <style> </style>src/components/Visibility.vue
該組件的代碼從Highlights.vue接收突出顯示的數據轉儲,提取 Visibility 的數據,並將其呈現在頁面上。
<template> <div> <p>Visibility: {{ visibility }}</p> </div> </template> <script> export default { props: ["highlights"], data () { return { visibility: this.highlights.visibility, } }, methods: { }, computed: { }, } </script> <style> </style>src/components/WindStatus.vue
該組件的代碼從Highlights.vue接收亮點的數據轉儲,提取風狀態(速度和方向)的數據,並將其呈現在頁面上。
<template> <div> <p>Wind Status:</p> <p>Speed — {{ speed }}; Direction — {{ direction }}</p> </div> </template> <script> export default { props: ["highlights"], data () { return { speed: this.highlights.windstatus.speed, direction: this.highlights.windstatus.direction } }, methods: { }, computed: { }, } </script> <style> </style>添加所有組件的代碼後,在瀏覽器上查看網頁。
不要灰心,但所有這些辛勤工作只是為了將組件連接到層次結構中,並測試它們之間是否發生數據流! 在下一節中,我們將扔掉迄今為止編寫的大部分代碼,並添加更多與實際項目相關的代碼。 但是,我們肯定會保留組件的結構和嵌套; 本節的學習將使我們能夠使用 Vue.js 構建一個體面的儀表板。
4. 數據採集與處理
還記得App.vue中的weather_data對象嗎? 它有一些硬編碼數據,我們用來測試所有組件是否正常工作,還可以幫助您了解 Vue 應用程序的一些基本方面,而不會陷入現實世界數據的細節中。 然而,現在是我們擺脫外殼,進入現實世界的時候了,來自 API 的數據將主導我們的大部分代碼。
準備子組件以接收和處理真實數據
在本節中,您將獲得除App.vue之外的所有組件的代碼轉儲。 該代碼將處理從App.vue接收真實數據(與我們在上一節中編寫的用於接收和渲染虛擬數據的代碼不同)。
我們強烈建議仔細閱讀每個組件的代碼,以便您了解每個組件所期望的數據,並最終在可視化中使用。
一些代碼和整體結構將與您在之前的結構中看到的相似——因此您不會面臨完全不同的情況。 然而,魔鬼在細節中! 因此,請仔細檢查代碼,當您對它們有相當好的理解時,將代碼複製到項目中的相應組件文件中。
注意:本節中的所有組件都在src/components/目錄中。 所以每次都不會提及路徑——只會提及.vue文件名來標識組件。
內容.vue
<template> <div> <temp-var-chart :tempVar="tempVar"></temp-var-chart> <today-highlights :highlights="highlights"></today-highlights> </div> </template> <script> import TempVarChart from './TempVarChart.vue'; import Highlights from './Highlights.vue'; export default { props: ['highlights', 'tempVar'], components: { 'temp-var-chart': TempVarChart, 'today-highlights': Highlights }, } </script>對之前的代碼進行了以下更改:
- 在
<template>中,{{ }}中的文本和數據已被刪除,因為我們現在只是接收數據並將其傳遞給子組件,而沒有呈現特定於該組件的內容。 - 在
export default {}中:-
props已更改以匹配父級將發送的數據對象:App.vue。 之所以更改 props,是因為App.vue本身會根據用戶的搜索查詢,展示它從天氣 API 和其他在線資源獲取的部分數據,並將其餘數據傳遞出去。 在我們之前寫的 dummy 代碼中,App.vue是在傳遞整個 dummy 數據轉儲,沒有任何區別,Content.vue的 props 也相應設置。 - data() 函數現在什麼都不返回,因為我們沒有在這個組件中進行任何數據操作。
-
TempVarChart.vue
該組件應該接收當天剩餘時間的詳細溫度預測,並最終使用 FusionCharts 顯示它們。 但目前,我們只會將它們顯示為網頁上的文本。
<template> <div> {{ tempVar.tempToday }} </div> </template> <script> export default { props: ["tempVar"], components: {}, data() { return { }; }, methods: { }, }; </script> <style> </style>亮點.vue
<template> <div> <uv-index :highlights="highlights"></uv-index> <visibility :highlights="highlights"></visibility> <wind-status :highlights="highlights"></wind-status> </div> </template> <script> import UVIndex from './UVIndex.vue'; import Visibility from './Visibility.vue'; import WindStatus from './WindStatus.vue'; export default { props: ["highlights"], components: { 'uv-index': UVIndex, 'visibility': Visibility, 'wind-status': WindStatus, }, data () { return { } }, methods: { }, computed: { }, } </script> <style> </style>對前面代碼所做的更改是:
- 在
<template>中,{{ }}中的文本和數據已被刪除,因為這是一個愚蠢的組件,就像Content.vue一樣,它的唯一工作是將數據傳遞給子級,同時保持結構層次結構。 請記住,諸如Highlights.vue和Content.vue之類的愚蠢組件的存在是為了保持儀表板的視覺結構與我們編寫的代碼之間的一致性。
UVIndex.vue
對之前代碼所做的更改如下:
- 在
<template>和<style>中,div id已更改為uvIndex,更具可讀性。 - 在
export default {}中,data()函數現在返回一個字符串對象uvIndex,其值是從組件使用props接收的 highlight 對像中提取的。 此uvIndex現在臨時用於將值顯示為<template>中的文本。 稍後,我們會將這個值插入到適合渲染圖表的數據結構中。
可見性.vue
<template> <div> <p>Visibility: {{ visibility }}</p> </div> </template> <script> export default { props: ["highlights"], data () { return { visibility: this.highlights.visibility.toString() } }, methods: { }, computed: { }, } </script> <style> </style> 這個文件中唯一的變化(相對於它之前的代碼)是data()函數返回的visibility對象的定義現在在其末尾包含toString() ,因為從父級接收到的值將是一個浮動的點數,需要轉成字符串。
WindStatus.vue
<template> <div> <p>Wind Speed — {{ windSpeed }}</p> <p>Wind Direction — {{ derivedWindDirection }}, or {{ windDirection }} degree clockwise with respect to true N as 0 degree.</p> </div> </template> <script> export default { props: ["highlights"], data () { return { windSpeed: this.highlights.windStatus.windSpeed, derivedWindDirection: this.highlights.windStatus.derivedWindDirection, windDirection: this.highlights.windStatus.windDirection } }, methods: { }, computed: { }, } </script> <style> </style>對之前代碼所做的更改如下:
- 在整個文件中,
windstatus已重命名為windStatus,以提高可讀性並與App.vue提供的帶有實際數據的 highlight 對象同步。 - 對速度和方向進行了類似的命名更改——新的命名為
windSpeed和windDirection。 - 一個新的對象
derivedWindDirection開始發揮作用(同樣由App.vue在 Highlights 包中提供)。
目前,接收到的數據呈現為文本; 稍後,它將被插入到可視化所需的數據結構中。
使用虛擬數據進行測試
反複使用虛擬數據可能會讓您有些沮喪,但背後有一些很好的理由:
- 我們對每個組件的代碼做了很多改動,最好測試一下這些改動是否破壞了代碼。 換句話說,我們應該檢查數據流是否完整,現在我們即將進入項目的更複雜部分。
- 來自在線天氣 API 的真實數據需要大量處理,並且您可能會在數據採集和處理代碼以及平滑數據流向組件的代碼之間折騰。 這個想法是控制複雜性的數量,以便我們更好地了解我們可能面臨的錯誤。
在本節中,我們所做的基本上是在App.vue中硬編碼一些 json 數據,這些數據顯然會在不久的將來被實時數據取代。 虛擬 json 結構與我們將用於實際數據的 json 結構之間有很多相似之處。 因此,它還為您提供了一個粗略的概念,即一旦我們遇到真實數據,可以期待什麼。
然而,我們承認這遠非從頭開始構建這樣一個項目時可能採用的理想方法。 在現實世界中,您通常會從真實的數據源開始,玩弄一下以了解可以和應該做些什麼來馴服它,然後考慮使用適當的 json 數據結構來捕獲相關信息。 我們故意讓你遠離所有那些骯髒的工作,因為它會讓你離目標更遠——學習如何使用 Vue.js 和 FusionCharts 來構建儀表板。
現在讓我們進入 App.vue 的新代碼:
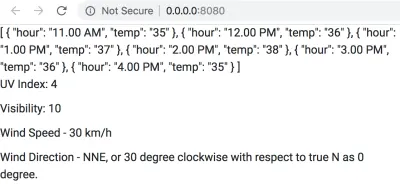
<template> <div> <dashboard-content :highlights="highlights" :tempVar="tempVar"></dashboard-content> </div> </template> <script> import Content from './components/Content.vue' export default { name: 'app', components: { 'dashboard-content': Content }, data () { return { tempVar: { tempToday: [ {hour: '11.00 AM', temp: '35'}, {hour: '12.00 PM', temp: '36'}, {hour: '1.00 PM', temp: '37'}, {hour: '2.00 PM', temp: '38'}, {hour: '3.00 PM', temp: '36'}, {hour: '4.00 PM', temp: '35'}, ], }, highlights: { uvIndex: 4, visibility: 10, windStatus: { windSpeed: '30 km/h', windDirection: '30', derivedWindDirection: 'NNE', }, }, } }, methods: { }, computed: { }, } </script> <style> </style>代碼相對於其先前版本所做的更改如下:
- 子組件的名稱已更改為dashboard-content,並且相應地修改了
<template>中的自定義 HTML 元素。 請注意,現在我們有兩個屬性 -highlights和tempVar- 而不是我們之前在自定義元素中使用的單個屬性。 因此,與這些屬性相關的數據也發生了變化。 有趣的是,我們可以使用v-bind:指令,或者它的簡寫:就像我們在這裡所做的那樣),以及自定義 HTML 元素的多個屬性! -
data()函數現在返回filename對象(之前存在的),以及兩個新對象(而不是舊的weather_data):tempVar和highlights。 json 的結構適合我們在子組件中編寫的代碼,以便它們可以從轉儲中提取所需的數據片段。 這些結構是不言自明的,當我們處理實時數據時,您可以期望它們非常相似。 但是,您將遇到的重大變化是沒有硬編碼(很明顯,不是嗎)——我們將保留這些值作為默認狀態空白,並編寫代碼以根據我們將從接收到的值動態更新它們天氣 API。
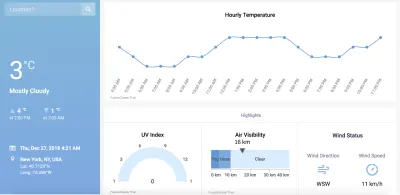
您在本節中編寫了很多代碼,但沒有看到實際輸出。 在繼續之前,請查看瀏覽器(如有必要,使用npm run dev重新啟動服務器),並享受您的成就的榮耀。 此時您應該看到的網頁如下圖所示:
數據採集和處理代碼
本節將成為項目的核心,所有代碼都將在App.vue中編寫,用於以下內容:
- 來自用戶的位置輸入——一個輸入框和一個號召性用語按鈕就足夠了;
- 各種任務的實用功能; 稍後將在組件代碼的各個部分調用這些函數;
- 從 Google Maps API for JavaScript 獲取詳細的地理位置數據;
- 從 Dark Sky API 獲取詳細的天氣數據;
- 格式化和處理地理定位和天氣數據,這些數據將傳遞給子組件。
以下小節說明了我們如何實現上述各點中為我們佈置的任務。 除了一些例外,他們中的大多數人都會遵循這個順序。
用戶輸入
很明顯,當用戶提供需要顯示天氣數據的地點名稱時,該操作就開始了。 為此,我們需要實現以下內容:
- 輸入位置的輸入框;
- 一個提交按鈕,告訴我們的應用程序用戶已經輸入了該位置,是時候完成剩下的工作了。 我們還將在點擊Enter開始處理時實現該行為。
我們在下面展示的代碼將被限制在App.vue的 HTML 模板部分。 我們只會提到與點擊事件關聯的方法的名稱,稍後在 App.vue 的 <script> 的方法對像中定義它們。
<div> <input type="text" ref="input" placeholder="Location?" @keyup.enter="organizeAllDetails" > <button @click="organizeAllDetails"> <img src="./assets/Search.svg" width="24" height="24"> </button> </div>將上面的代碼片段放在正確的位置是微不足道的——我們把它留給你。 然而,片段中有趣的部分是:
-
@keyup.enter="organizeAllDetails" -
@click="organizeAllDetails"
正如您從前面的部分中知道的那樣, @是 Vue 對指令v-on : 的簡寫,它與某些事件相關聯。 新事物是“ organizeAllDetails ”——它只不過是在事件(按Enter或單擊按鈕)發生時觸發的方法。 我們還沒有定義方法,這個謎題將在本節結束時完成。
App.vue 控制的文本信息顯示
一旦用戶輸入觸發操作並從 API 獲取大量數據,我們就會遇到不可避免的問題——“如何處理所有這些數據?”。 顯然需要一些數據按摩,但這並不能完全回答我們的問題! 我們需要決定數據的最終用途是什麼,或者更直接地說,哪些實體接收不同的採集和處理數據塊?
App.vue的子組件,基於它們的層次結構和用途,是大量數據的前線競爭者。 但是,我們也會有一些不屬於任何這些子組件的數據,但它們的信息量很大,並使儀表板變得完整。 如果我們將它們顯示為由App.vue直接控制的文本信息,我們可以很好地利用它們,而其餘的數據則傳遞給孩子最終顯示為漂亮的圖表。
考慮到這一點,讓我們專注於設置使用文本數據的階段的代碼。 在這一點上,它是一個簡單的 HTML 模板,數據最終會出現在它上面。
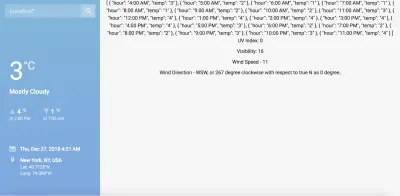
<div> <div class="wrapper-left"> <div> {{ currentWeather.temp }} <span>°C</span> </div> <div>{{ currentWeather.summary }}</div> <div class="temp-max-min"> <div class="max-desc"> <div> <i>▲</i> {{ currentWeather.todayHighLow.todayTempHigh }} <span>°C</span> </div> <div>at {{ currentWeather.todayHighLow.todayTempHighTime }}</div> </div> <div class="min-desc"> <div> <i>▼</i> {{ currentWeather.todayHighLow.todayTempLow }} <span>°C</span> </div> <div>at {{ currentWeather.todayHighLow.todayTempLowTime }}</div> </div> </div> </div> <div class="wrapper-right"> <div class="date-time-info"> <div> <img src="./assets/calendar.svg" width="20" height="20"> {{ currentWeather.time }} </div> </div> <div class="location-info"> <div> <img src="./assets/location.svg" width="10.83" height="15.83" > {{ currentWeather.full_location }} <div class="mt-1"> Lat: {{ currentWeather.formatted_lat }} <br> Long: {{ currentWeather.formatted_long }} </div> </div> </div> </div> </div>在上面的代碼片段中,您應該了解以下內容:
-
{{ }}裡面的東西——它們是 Vue 在 HTML 模板中插入動態數據的方式,然後在瀏覽器中呈現。 你以前遇到過它們,沒有什麼新鮮的或令人驚訝的。 請記住,這些數據對像源自App.vue的export default()對像中的data()方法。 它們有默認值,我們將根據我們的要求設置,然後編寫某些方法來用真實的 API 數據填充對象。
不用擔心在瀏覽器上看不到變化——數據還沒有定義,Vue 不渲染它不知道的東西是很自然的。 但是,一旦設置了數據(現在,您甚至可以通過硬編碼數據來檢查),文本數據將由App.vue控制。
data()方法
data()方法是.vue文件中的一個特殊結構——它包含並返回對應用程序至關重要的數據對象。 回憶一下任何.vue文件中<script>部分的通用結構——它大致包含以下內容:
<script> // import statements here export default { // name, components, props, etc. data() { return { // the data that is so crucial for the application is defined here. // the data objects will have certain default values chosen by us. // The methods that we define below will manipulate the data. // Since the data is bounded to various attributes and directives, they // will update as and when the values of the data objects change. } }, methods: { // methods (objects whose values are functions) here. // bulk of dynamic stuff (the black magic part) is controlled from here. }, computed: { // computed properties here }, // other objects, as necessary } </script> 到目前為止,您已經遇到了一些數據對象的名稱,但還有很多。 它們中的大多數都與子組件相關,每個子組件處理天氣信息轉儲的不同方面。 下面給出了我們在這個項目中需要的整個data()方法——根據對象的命名,您將對我們期望從 API 獲得哪些數據以及我們如何傳播數據有一個清晰的認識。
data() { return { weatherDetails: false, location: '', // raw location from input lat: '', // raw latitude from google maps api response long: '', // raw longitude from google maps api response completeWeatherApi: '', // weather api string with lat and long rawWeatherData: '', // raw response from weather api currentWeather: { full_location: '', // for full address formatted_lat: '', // for N/S formatted_long: '', // for E/W time: '', temp: '', todayHighLow: { todayTempHigh: '', todayTempHighTime: '', todayTempLow: '', todayTempLowTime: '' }, summary: '', possibility: '' }, tempVar: { tempToday: [ // gets added dynamically by this.getSetHourlyTempInfoToday() ], }, highlights: { uvIndex: '', visibility: '', windStatus: { windSpeed: '', windDirection: '', derivedWindDirection: '' }, } }; },如您所見,在大多數情況下,默認值為空,因為此時就足夠了。 在渲染或傳遞給子組件之前,將編寫用於操作數據並用適當的值填充數據的方法。
App.vue 中的方法
對於.vue文件,方法通常寫為嵌套在methods { }對像中的鍵值。 它們的主要作用是操作組件的數據對象。 我們將在App.vue中編寫方法,牢記相同的理念。 但是,根據它們的用途,我們可以將App.vue的方法分為以下幾類:
- 實用方法
- 面向動作/事件的方法
- 數據採集方法
- 數據處理方法
- 高級膠水方法
理解這一點很重要——我們將這些方法呈現給您,因為我們已經弄清楚了 API 的工作原理、它們提供的數據以及我們應該如何在項目中使用這些數據。 並不是說我們憑空抽出這些方法,並編寫了一些晦澀難懂的代碼來處理數據。 出於學習的目的,認真閱讀和理解方法和數據的代碼是一個很好的練習。 但是,當面對一個必須從頭開始構建的新項目時,您必須自己完成所有繁瑣的工作,這意味著要對 API 進行大量試驗——它們的編程訪問和數據結構,然後才能將它們與數據無縫粘合您的項目所需的結構。 你不會有任何牽手,也會有令人沮喪的時刻,但這都是成熟的開發人員的一部分。
在下面的小節中,我們將解釋每種方法類型,並展示屬於該類別的方法的實現。 方法名稱對於它們的目的是不言自明的,它們的實現也是如此,我們相信你會發現它們很容易理解。 不過,在此之前,回憶一下.vue文件中寫方法的大致方案:
<script> // import statements here export default { // name, components, props, etc. data() { return { // the data that is so crucial for the application is defined here. } }, methods: { // methods (objects whose values are functions) here. // bulk of dynamic stuff (the black magic part) is controlled from here. method_1: function(arg_1) { }, method_2: function(arg_1, arg_2) { }, method_3: function(arg_1) { }, ……. }, computed: { // computed properties here }, // other objects, as necessary } </script>實用方法
顧名思義,實用程序方法是主要為模塊化用於邊緣任務的重複代碼而編寫的方法。 必要時通過其他方法調用它們。 下面給出了App.vue的實用方法:
convertToTitleCase: function(str) { str = str.toLowerCase().split(' '); for (var i = 0; i < str.length; i++) { str[i] = str[i].charAt(0).toUpperCase() + str[i].slice(1); } return str.join(' '); }, // To format the “possibility” (of weather) string obtained from the weather API formatPossibility: function(str) { str = str.toLowerCase().split('-'); for (var i = 0; i < str.length; i++) { str[i] = str[i].charAt(0).toUpperCase() + str[i].slice(1); } return str.join(' '); }, // To convert Unix timestamps according to our convenience unixToHuman: function(timezone, timestamp) { /* READ THIS BEFORE JUDGING & DEBUGGING For any location beyond the arctic circle and the antarctic circle, the goddamn weather api does not return certain keys/values in each of this.rawWeatherData.daily.data[some_array_index]. Due to this, console throws up an error. The code is correct, the problem is with the API. May be later on I will add some padding to tackle missing values. */ var moment = require('moment-timezone'); // for handling date & time var decipher = new Date(timestamp * 1000); var human = moment(decipher) .tz(timezone) .format('llll'); var timeArray = human.split(' '); var timeNumeral = timeArray[4]; var timeSuffix = timeArray[5]; var justTime = timeNumeral + ' ' + timeSuffix; var monthDateArray = human.split(','); var monthDate = monthDateArray[1].trim(); return { fullTime: human, onlyTime: justTime, onlyMonthDate: monthDate }; }, // To convert temperature from fahrenheit to celcius fahToCel: function(tempInFahrenheit) { var tempInCelcius = Math.round((5 / 9) * (tempInFahrenheit — 32)); return tempInCelcius; }, // To convert the air pressure reading from millibar to kilopascal milibarToKiloPascal: function(pressureInMilibar) { var pressureInKPA = pressureInMilibar * 0.1; return Math.round(pressureInKPA); }, // To convert distance readings from miles to kilometers mileToKilometer: function(miles) { var kilometer = miles * 1.60934; return Math.round(kilometer); }, // To format the wind direction based on the angle deriveWindDir: function(windDir) { var wind_directions_array = [ { minVal: 0, maxVal: 30, direction: 'N' }, { minVal: 31, maxVal: 45, direction: 'NNE' }, { minVal: 46, maxVal: 75, direction: 'NE' }, { minVal: 76, maxVal: 90, direction: 'ENE' }, { minVal: 91, maxVal: 120, direction: 'E' }, { minVal: 121, maxVal: 135, direction: 'ESE' }, { minVal: 136, maxVal: 165, direction: 'SE' }, { minVal: 166, maxVal: 180, direction: 'SSE' }, { minVal: 181, maxVal: 210, direction: 'S' }, { minVal: 211, maxVal: 225, direction: 'SSW' }, { minVal: 226, maxVal: 255, direction: 'SW' }, { minVal: 256, maxVal: 270, direction: 'WSW' }, { minVal: 271, maxVal: 300, direction: 'W' }, { minVal: 301, maxVal: 315, direction: 'WNW' }, { minVal: 316, maxVal: 345, direction: 'NW' }, { minVal: 346, maxVal: 360, direction: 'NNW' } ]; var wind_direction = ''; for (var i = 0; i < wind_directions_array.length; i++) { if ( windDir >= wind_directions_array[i].minVal && windDir <= wind_directions_array[i].maxVal ) { wind_direction = wind_directions_array[i].direction; } } return wind_direction; }, 雖然我們還沒有實現它,但你可以從.vue文件中取出實用方法,並將其放在一個單獨的 JavaScript 文件中。 您需要做的就是在.vue文件中腳本部分的開頭導入.js文件,然後就可以開始了。 這種方法非常有效,並且可以保持代碼乾淨,尤其是在大型應用程序中,您可能會使用許多根據用途更好地組合在一起的方法。 您可以將此方法應用於本文中列出的所有方法組,並查看效果本身。 但是,我們建議您在完成此處介紹的課程後進行該練習,以便您全面了解所有同步工作的部分,並擁有一個可以參考的工作軟件試驗時休息。

面向動作/事件的方法
這些方法一般在我們需要對某個事件採取對應的動作時執行。 根據具體情況,事件可能由用戶交互觸發,也可能以編程方式觸發。 在App.vue文件中,這些方法位於實用程序方法的下方。
makeInputEmpty: function() { this.$refs.input.value = ''; }, makeTempVarTodayEmpty: function() { this.tempVar.tempToday = []; }, detectEnterKeyPress: function() { var input = this.$refs.input; input.addEventListener('keyup', function(event) { event.preventDefault(); var enterKeyCode = 13; if (event.keyCode === enterKeyCode) { this.setHitEnterKeyTrue(); } }); }, locationEntered: function() { var input = this.$refs.input; if (input.value === '') { this.location = "New York"; } else { this.location = this.convertToTitleCase(input.value); } this.makeInputEmpty(); this.makeTempVarTodayEmpty(); }, 在上面的一些代碼片段中,一件有趣的事情是$ref的使用。 簡單來說,這是 Vue 將包含它的代碼語句與它應該影響的 HTML 結構相關聯的方式(有關更多信息,請閱讀官方指南)。 例如,方法makeInputEmpty()和detectEnterKeyPress()會影響輸入框,因為在輸入框的 HTML 中我們提到了屬性ref的值作為input 。
數據採集方法
我們在項目中使用了以下兩個 API:
- 谷歌地圖地理編碼器 API
此 API 用於獲取用戶搜索位置的坐標。 您將需要自己的 API 密鑰,您可以按照給定鏈接中的文檔獲取該密鑰。 目前,您可以使用 FusionCharts 使用的 API 密鑰,但我們要求您不要濫用它並獲取自己的密鑰。 我們從這個項目的 index.html 中引用了 JavaScript API,我們將使用它提供的構造函數來處理我們在App.vue文件中的代碼。 - 黑暗天空天氣 API
該接口用於獲取坐標對應的天氣數據。 但是,我們不會直接使用它; 我們將把它包裝在一個通過 FusionCharts 的服務器之一重定向的 URL 中。 原因是,如果您從像我們這樣的完全客戶端應用程序向 API 發送 GET 請求,則會導致令人沮喪的CORS錯誤(此處和此處的更多信息)。
重要提示:由於我們使用了 Google Maps 和 Dark Sky API,這兩個 API 都有自己的 API 密鑰,我們在本文中與您分享了這些密鑰。 這將幫助您專注於客戶端開發,而不是令人頭疼的後端實現。 但是,我們建議您創建自己的密鑰,因為我們的 API 密鑰會附帶限制,如果超過這些限制,您將無法自行嘗試應用程序。
對於 Google 地圖,請參閱本文以獲取您的 API 密鑰。 對於 Dark Sky API,請訪問 https://darksky.net/dev 以創建您的 API 密鑰和相應的端點。
考慮到上下文,讓我們看看我們項目的數據採集方法的實現。
getCoordinates: function() { this.locationEntered(); var loc = this.location; var coords; var geocoder = new google.maps.Geocoder(); return new Promise(function(resolve, reject) { geocoder.geocode({ address: loc }, function(results, status) { if (status == google.maps.GeocoderStatus.OK) { this.lat = results[0].geometry.location.lat(); this.long = results[0].geometry.location.lng(); this.full_location = results[0].formatted_address; coords = { lat: this.lat, long: this.long, full_location: this.full_location }; resolve(coords); } else { alert("Oops! Couldn't get data for the location"); } }); }); }, /* The coordinates that Google Maps Geocoder API returns are way too accurate for our requirements. We need to bring it into shape before passing the coordinates on to the weather API. Although this is a data processing method in its own right, we can't help mentioning it right now, because the data acquisition method for the weather API has dependency on the output of this method. */ setFormatCoordinates: async function() { var coordinates = await this.getCoordinates(); this.lat = coordinates.lat; this.long = coordinates.long; this.currentWeather.full_location = coordinates.full_location; // Remember to beautify lat for N/S if (coordinates.lat > 0) { this.currentWeather.formatted_lat = (Math.round(coordinates.lat * 10000) / 10000).toString() + '°N'; } else if (coordinates.lat < 0) { this.currentWeather.formatted_lat = (-1 * (Math.round(coordinates.lat * 10000) / 10000)).toString() + '°S'; } else { this.currentWeather.formatted_lat = ( Math.round(coordinates.lat * 10000) / 10000 ).toString(); } // Remember to beautify long for N/S if (coordinates.long > 0) { this.currentWeather.formatted_long = (Math.round(coordinates.long * 10000) / 10000).toString() + '°E'; } else if (coordinates.long < 0) { this.currentWeather.formatted_long = (-1 * (Math.round(coordinates.long * 10000) / 10000)).toString() + '°W'; } else { this.currentWeather.formatted_long = ( Math.round(coordinates.long * 10000) / 10000 ).toString(); } }, /* This method dynamically creates the the correct weather API query URL, based on the formatted latitude and longitude. The complete URL is then fed to the method querying for weather data. Notice that the base URL used in this method (without the coordinates) points towards a FusionCharts server — we must redirect our GET request to the weather API through a server to avoid the CORS error. */ fixWeatherApi: async function() { await this.setFormatCoordinates(); var weatherApi = 'https://csm.fusioncharts.com/files/assets/wb/wb-data.php?src=darksky&lat=' + this.lat + '&long=' + this.long; this.completeWeatherApi = weatherApi; }, fetchWeatherData: async function() { await this.fixWeatherApi(); var axios = require('axios'); // for handling weather api promise var weatherApiResponse = await axios.get(this.completeWeatherApi); if (weatherApiResponse.status === 200) { this.rawWeatherData = weatherApiResponse.data; } else { alert('Hmm... Seems like our weather experts are busy!'); } },Through these methods, we have introduced the concept of async-await in our code. If you have been a JavaScript developer for some time now, you must be familiar with the callback hell, which is a direct consequence of the asynchronous way JavaScript is written. ES6 allows us to bypass the cumbersome nested callbacks, and our code becomes much cleaner if we write JavaScript in a synchronous way, using the async-await technique. However, there is a downside. It takes away the speed that asynchronous code gives us, especially for the portions of the code that deals with data being exchanged over the internet. Since this is not a mission-critical application with low latency requirements, and our primary aim is to learn stuff, the clean code is much more preferable over the slightly fast code.
Data Processing Methods
Now that we have the methods that will bring the data to us, we need to prepare the ground for properly receiving and processing the data. Safety nets must be cast, and there should be no spills — data is the new gold (OK, that might be an exaggeration in our context)! Enough with the fuss, let's get to the point.
Technically, the methods we implement in this section are aimed at getting the data out of the acquisition methods and the data objects in App.vue , and sometimes setting the data objects to certain values that suits the purpose.
getTimezone: function() { return this.rawWeatherData.timezone; }, getSetCurrentTime: function() { var currentTime = this.rawWeatherData.currently.time; var timezone = this.getTimezone(); this.currentWeather.time = this.unixToHuman( timezone, currentTime ).fullTime; }, getSetSummary: function() { var currentSummary = this.convertToTitleCase( this.rawWeatherData.currently.summary ); if (currentSummary.includes(' And')) { currentSummary = currentSummary.replace(' And', ','); } this.currentWeather.summary = currentSummary; }, getSetPossibility: function() { var possible = this.formatPossibility(this.rawWeatherData.daily.icon); if (possible.includes(' And')) { possible = possible.replace(' And', ','); } this.currentWeather.possibility = possible; }, getSetCurrentTemp: function() { var currentTemp = this.rawWeatherData.currently.temperature; this.currentWeather.temp = this.fahToCel(currentTemp); }, getTodayDetails: function() { return this.rawWeatherData.daily.data[0]; }, getSetTodayTempHighLowWithTime: function() { var timezone = this.getTimezone(); var todayDetails = this.getTodayDetails(); this.currentWeather.todayHighLow.todayTempHigh = this.fahToCel( todayDetails.temperatureMax ); this.currentWeather.todayHighLow.todayTempHighTime = this.unixToHuman( timezone, todayDetails.temperatureMaxTime ).onlyTime; this.currentWeather.todayHighLow.todayTempLow = this.fahToCel( todayDetails.temperatureMin ); this.currentWeather.todayHighLow.todayTempLowTime = this.unixToHuman( timezone, todayDetails.temperatureMinTime ).onlyTime; }, getHourlyInfoToday: function() { return this.rawWeatherData.hourly.data; }, getSetHourlyTempInfoToday: function() { var unixTime = this.rawWeatherData.currently.time; var timezone = this.getTimezone(); var todayMonthDate = this.unixToHuman(timezone, unixTime).onlyMonthDate; var hourlyData = this.getHourlyInfoToday(); for (var i = 0; i < hourlyData.length; i++) { var hourlyTimeAllTypes = this.unixToHuman(timezone, hourlyData[i].time); var hourlyOnlyTime = hourlyTimeAllTypes.onlyTime; var hourlyMonthDate = hourlyTimeAllTypes.onlyMonthDate; if (todayMonthDate === hourlyMonthDate) { var hourlyObject = { hour: '', temp: '' }; hourlyObject.hour = hourlyOnlyTime; hourlyObject.temp = this.fahToCel(hourlyData[i].temperature).toString(); this.tempVar.tempToday.push(hourlyObject); /* Since we are using array.push(), we are just adding elements at the end of the array. Thus, the array is not getting emptied first when a new location is entered. to solve this problem, a method this.makeTempVarTodayEmpty() has been created, and called from this.locationEntered(). */ } } /* To cover the edge case where the local time is between 10 — 12 PM, and therefore there are only two elements in the array this.tempVar.tempToday. We need to add the points for minimum temperature and maximum temperature so that the chart gets generated with atleast four points. */ if (this.tempVar.tempToday.length <= 2) { var minTempObject = { hour: this.currentWeather.todayHighLow.todayTempHighTime, temp: this.currentWeather.todayHighLow.todayTempHigh }; var maxTempObject = { hour: this.currentWeather.todayHighLow.todayTempLowTime, temp: this.currentWeather.todayHighLow.todayTempLow }; /* Typically, lowest temp are at dawn, highest temp is around mid day. Thus we can safely arrange like min, max, temp after 10 PM. */ // array.unshift() adds stuff at the beginning of the array. // the order will be: min, max, 10 PM, 11 PM. this.tempVar.tempToday.unshift(maxTempObject, minTempObject); } }, getSetUVIndex: function() { var uvIndex = this.rawWeatherData.currently.uvIndex; this.highlights.uvIndex = uvIndex; }, getSetVisibility: function() { var visibilityInMiles = this.rawWeatherData.currently.visibility; this.highlights.visibility = this.mileToKilometer(visibilityInMiles); }, getSetWindStatus: function() { var windSpeedInMiles = this.rawWeatherData.currently.windSpeed; this.highlights.windStatus.windSpeed = this.mileToKilometer( windSpeedInMiles ); var absoluteWindDir = this.rawWeatherData.currently.windBearing; this.highlights.windStatus.windDirection = absoluteWindDir; this.highlights.windStatus.derivedWindDirection = this.deriveWindDir( absoluteWindDir ); },高級膠水方法
使用實用程序、獲取和處理方法,我們現在剩下的任務是編排整個事情。 我們通過創建高級粘合方法來做到這一點,它基本上以特定順序調用上面編寫的方法,以便整個操作無縫執行。
// Top level for info section // Data in this.currentWeather organizeCurrentWeatherInfo: function() { // data in this.currentWeather /* Coordinates and location is covered (get & set) in: — this.getCoordinates() — this.setFormatCoordinates() There are lots of async-await involved there. So it's better to keep them there. */ this.getSetCurrentTime(); this.getSetCurrentTemp(); this.getSetTodayTempHighLowWithTime(); this.getSetSummary(); this.getSetPossibility(); }, // Top level for highlights organizeTodayHighlights: function() { // top level for highlights this.getSetUVIndex(); this.getSetVisibility(); this.getSetWindStatus(); }, // Top level organization and rendering organizeAllDetails: async function() { // top level organization await this.fetchWeatherData(); this.organizeCurrentWeatherInfo(); this.organizeTodayHighlights(); this.getSetHourlyTempInfoToday(); },安裝
Vue 提供了實例生命週期鉤子——本質上是方法的屬性,並在實例生命週期到達該階段時被觸發。 例如,created、mounted、beforeUpdate 等都是非常有用的生命週期鉤子,允許程序員在比其他方式更精細的級別控制實例。
在 Vue 組件的代碼中,這些生命週期鉤子的實現就像您對任何其他prop一樣。 例如:
<template> </template> <script> // import statements export default { data() { return { // data objects here } }, methods: { // methods here }, mounted: function(){ // function body here }, } </script> <style> </style> 有了這個新的理解,看看下面mounted的App.vue的代碼:
mounted: async function() { this.location = "New York"; await this.organizeAllDetails(); }App.vue 的完整代碼
我們在本節中介紹了很多內容,最後幾節為您提供了一些零碎的東西。 但是,擁有完整的App.vue組裝代碼很重要(在後續部分中可能會進一步修改)。 它是這樣的:
<template> <div> <div class="container-fluid"> <div class="row"> <div class="col-md-3 col-sm-4 col-xs-12 sidebar"> <div> <input type="text" ref="input" placeholder="Location?" @keyup.enter="organizeAllDetails" > <button @click="organizeAllDetails"> <img src="./assets/Search.svg" width="24" height="24"> </button> </div> <div> <div class="wrapper-left"> <div> {{ currentWeather.temp }} <span>°C</span> </div> <div>{{ currentWeather.summary }}</div> <div class="temp-max-min"> <div class="max-desc"> <div> <i>▲</i> {{ currentWeather.todayHighLow.todayTempHigh }} <span>°C</span> </div> <div>at {{ currentWeather.todayHighLow.todayTempHighTime }}</div> </div> <div class="min-desc"> <div> <i>▼</i> {{ currentWeather.todayHighLow.todayTempLow }} <span>°C</span> </div> <div>at {{ currentWeather.todayHighLow.todayTempLowTime }}</div> </div> </div> </div> <div class="wrapper-right"> <div class="date-time-info"> <div> <img src="./assets/calendar.svg" width="20" height="20"> {{ currentWeather.time }} </div> </div> <div class="location-info"> <div> <img src="./assets/location.svg" width="10.83" height="15.83" > {{ currentWeather.full_location }} <div class="mt-1"> Lat: {{ currentWeather.formatted_lat }} <br> Long: {{ currentWeather.formatted_long }} </div> </div> </div> </div> </div> </div> <dashboard-content class="col-md-9 col-sm-8 col-xs-12 content" :highlights="highlights" :tempVar="tempVar" ></dashboard-content> </div> </div> </div> </template> <script> import Content from './components/Content.vue'; export default { name: 'app', props: [], components: { 'dashboard-content': Content }, data() { return { weatherDetails: false, location: '', // raw location from input lat: '', // raw latitude from google maps api response long: '', // raw longitude from google maps api response completeWeatherApi: '', // weather api string with lat and long rawWeatherData: '', // raw response from weather api currentWeather: { full_location: '', // for full address formatted_lat: '', // for N/S formatted_long: '', // for E/W time: '', temp: '', todayHighLow: { todayTempHigh: '', todayTempHighTime: '', todayTempLow: '', todayTempLowTime: '' }, summary: '', possibility: '' }, tempVar: { tempToday: [ // gets added dynamically by this.getSetHourlyTempInfoToday() ], }, highlights: { uvIndex: '', visibility: '', windStatus: { windSpeed: '', windDirection: '', derivedWindDirection: '' }, } }; }, methods: { // Some utility functions convertToTitleCase: function(str) { str = str.toLowerCase().split(' '); for (var i = 0; i < str.length; i++) { str[i] = str[i].charAt(0).toUpperCase() + str[i].slice(1); } return str.join(' '); }, formatPossibility: function(str) { str = str.toLowerCase().split('-'); for (var i = 0; i < str.length; i++) { str[i] = str[i].charAt(0).toUpperCase() + str[i].slice(1); } return str.join(' '); }, unixToHuman: function(timezone, timestamp) { /* READ THIS BEFORE JUDGING & DEBUGGING For any location beyond the arctic circle and the antarctic circle, the goddamn weather api does not return certain keys/values in each of this.rawWeatherData.daily.data[some_array_index]. Due to this, console throws up an error. The code is correct, the problem is with the API. May be later on I will add some padding to tackle missing values. */ var moment = require('moment-timezone'); // for handling date & time var decipher = new Date(timestamp * 1000); var human = moment(decipher) .tz(timezone) .format('llll'); var timeArray = human.split(' '); var timeNumeral = timeArray[4]; var timeSuffix = timeArray[5]; var justTime = timeNumeral + ' ' + timeSuffix; var monthDateArray = human.split(','); var monthDate = monthDateArray[1].trim(); return { fullTime: human, onlyTime: justTime, onlyMonthDate: monthDate }; }, fahToCel: function(tempInFahrenheit) { var tempInCelcius = Math.round((5 / 9) * (tempInFahrenheit — 32)); return tempInCelcius; }, milibarToKiloPascal: function(pressureInMilibar) { var pressureInKPA = pressureInMilibar * 0.1; return Math.round(pressureInKPA); }, mileToKilometer: function(miles) { var kilometer = miles * 1.60934; return Math.round(kilometer); }, deriveWindDir: function(windDir) { var wind_directions_array = [ { minVal: 0, maxVal: 30, direction: 'N' }, { minVal: 31, maxVal: 45, direction: 'NNE' }, { minVal: 46, maxVal: 75, direction: 'NE' }, { minVal: 76, maxVal: 90, direction: 'ENE' }, { minVal: 91, maxVal: 120, direction: 'E' }, { minVal: 121, maxVal: 135, direction: 'ESE' }, { minVal: 136, maxVal: 165, direction: 'SE' }, { minVal: 166, maxVal: 180, direction: 'SSE' }, { minVal: 181, maxVal: 210, direction: 'S' }, { minVal: 211, maxVal: 225, direction: 'SSW' }, { minVal: 226, maxVal: 255, direction: 'SW' }, { minVal: 256, maxVal: 270, direction: 'WSW' }, { minVal: 271, maxVal: 300, direction: 'W' }, { minVal: 301, maxVal: 315, direction: 'WNW' }, { minVal: 316, maxVal: 345, direction: 'NW' }, { minVal: 346, maxVal: 360, direction: 'NNW' } ]; var wind_direction = ''; for (var i = 0; i < wind_directions_array.length; i++) { if ( windDir >= wind_directions_array[i].minVal && windDir <= wind_directions_array[i].maxVal ) { wind_direction = wind_directions_array[i].direction; } } return wind_direction; }, // Some basic action oriented functions makeInputEmpty: function() { this.$refs.input.value = ''; }, makeTempVarTodayEmpty: function() { this.tempVar.tempToday = []; }, detectEnterKeyPress: function() { var input = this.$refs.input; input.addEventListener('keyup', function(event) { event.preventDefault(); var enterKeyCode = 13; if (event.keyCode === enterKeyCode) { this.setHitEnterKeyTrue(); } }); }, locationEntered: function() { var input = this.$refs.input; if (input.value === '') { this.location = "New York"; } else { this.location = this.convertToTitleCase(input.value); } this.makeInputEmpty(); this.makeTempVarTodayEmpty(); }, getCoordinates: function() { this.locationEntered(); var loc = this.location; var coords; var geocoder = new google.maps.Geocoder(); return new Promise(function(resolve, reject) { geocoder.geocode({ address: loc }, function(results, status) { if (status == google.maps.GeocoderStatus.OK) { this.lat = results[0].geometry.location.lat(); this.long = results[0].geometry.location.lng(); this.full_location = results[0].formatted_address; coords = { lat: this.lat, long: this.long, full_location: this.full_location }; resolve(coords); } else { alert("Oops! Couldn't get data for the location"); } }); }); }, // Some basic asynchronous functions setFormatCoordinates: async function() { var coordinates = await this.getCoordinates(); this.lat = coordinates.lat; this.long = coordinates.long; this.currentWeather.full_location = coordinates.full_location; // Remember to beautify lat for N/S if (coordinates.lat > 0) { this.currentWeather.formatted_lat = (Math.round(coordinates.lat * 10000) / 10000).toString() + '°N'; } else if (coordinates.lat < 0) { this.currentWeather.formatted_lat = (-1 * (Math.round(coordinates.lat * 10000) / 10000)).toString() + '°S'; } else { this.currentWeather.formatted_lat = ( Math.round(coordinates.lat * 10000) / 10000 ).toString(); } // Remember to beautify long for N/S if (coordinates.long > 0) { this.currentWeather.formatted_long = (Math.round(coordinates.long * 10000) / 10000).toString() + '°E'; } else if (coordinates.long < 0) { this.currentWeather.formatted_long = (-1 * (Math.round(coordinates.long * 10000) / 10000)).toString() + '°W'; } else { this.currentWeather.formatted_long = ( Math.round(coordinates.long * 10000) / 10000 ).toString(); } }, fixWeatherApi: async function() { await this.setFormatCoordinates(); var weatherApi = 'https://csm.fusioncharts.com/files/assets/wb/wb-data.php?src=darksky&lat=' + this.lat + '&long=' + this.long; this.completeWeatherApi = weatherApi; }, fetchWeatherData: async function() { await this.fixWeatherApi(); var axios = require('axios'); // for handling weather api promise var weatherApiResponse = await axios.get(this.completeWeatherApi); if (weatherApiResponse.status === 200) { this.rawWeatherData = weatherApiResponse.data; } else { alert('Hmm... Seems like our weather experts are busy!'); } }, // Get and set functions; often combined, because they are short // For basic info — left panel/sidebar getTimezone: function() { return this.rawWeatherData.timezone; }, getSetCurrentTime: function() { var currentTime = this.rawWeatherData.currently.time; var timezone = this.getTimezone(); this.currentWeather.time = this.unixToHuman( timezone, currentTime ).fullTime; }, getSetSummary: function() { var currentSummary = this.convertToTitleCase( this.rawWeatherData.currently.summary ); if (currentSummary.includes(' And')) { currentSummary = currentSummary.replace(' And', ','); } this.currentWeather.summary = currentSummary; }, getSetPossibility: function() { var possible = this.formatPossibility(this.rawWeatherData.daily.icon); if (possible.includes(' And')) { possible = possible.replace(' And', ','); } this.currentWeather.possibility = possible; }, getSetCurrentTemp: function() { var currentTemp = this.rawWeatherData.currently.temperature; this.currentWeather.temp = this.fahToCel(currentTemp); }, getTodayDetails: function() { return this.rawWeatherData.daily.data[0]; }, getSetTodayTempHighLowWithTime: function() { var timezone = this.getTimezone(); var todayDetails = this.getTodayDetails(); this.currentWeather.todayHighLow.todayTempHigh = this.fahToCel( todayDetails.temperatureMax ); this.currentWeather.todayHighLow.todayTempHighTime = this.unixToHuman( timezone, todayDetails.temperatureMaxTime ).onlyTime; this.currentWeather.todayHighLow.todayTempLow = this.fahToCel( todayDetails.temperatureMin ); this.currentWeather.todayHighLow.todayTempLowTime = this.unixToHuman( timezone, todayDetails.temperatureMinTime ).onlyTime; }, getHourlyInfoToday: function() { return this.rawWeatherData.hourly.data; }, getSetHourlyTempInfoToday: function() { var unixTime = this.rawWeatherData.currently.time; var timezone = this.getTimezone(); var todayMonthDate = this.unixToHuman(timezone, unixTime).onlyMonthDate; var hourlyData = this.getHourlyInfoToday(); for (var i = 0; i < hourlyData.length; i++) { var hourlyTimeAllTypes = this.unixToHuman(timezone, hourlyData[i].time); var hourlyOnlyTime = hourlyTimeAllTypes.onlyTime; var hourlyMonthDate = hourlyTimeAllTypes.onlyMonthDate; if (todayMonthDate === hourlyMonthDate) { var hourlyObject = { hour: '', temp: '' }; hourlyObject.hour = hourlyOnlyTime; hourlyObject.temp = this.fahToCel(hourlyData[i].temperature).toString(); this.tempVar.tempToday.push(hourlyObject); /* Since we are using array.push(), we are just adding elements at the end of the array. Thus, the array is not getting emptied first when a new location is entered. to solve this problem, a method this.makeTempVarTodayEmpty() has been created, and called from this.locationEntered(). */ } } /* To cover the edge case where the local time is between 10 — 12 PM, and therefore there are only two elements in the array this.tempVar.tempToday. We need to add the points for minimum temperature and maximum temperature so that the chart gets generated with atleast four points. */ if (this.tempVar.tempToday.length <= 2) { var minTempObject = { hour: this.currentWeather.todayHighLow.todayTempHighTime, temp: this.currentWeather.todayHighLow.todayTempHigh }; var maxTempObject = { hour: this.currentWeather.todayHighLow.todayTempLowTime, temp: this.currentWeather.todayHighLow.todayTempLow }; /* Typically, lowest temp are at dawn, highest temp is around mid day. Thus we can safely arrange like min, max, temp after 10 PM. */ // array.unshift() adds stuff at the beginning of the array. // the order will be: min, max, 10 PM, 11 PM. this.tempVar.tempToday.unshift(maxTempObject, minTempObject); } }, // For Today Highlights getSetUVIndex: function() { var uvIndex = this.rawWeatherData.currently.uvIndex; this.highlights.uvIndex = uvIndex; }, getSetVisibility: function() { var visibilityInMiles = this.rawWeatherData.currently.visibility; this.highlights.visibility = this.mileToKilometer(visibilityInMiles); }, getSetWindStatus: function() { var windSpeedInMiles = this.rawWeatherData.currently.windSpeed; this.highlights.windStatus.windSpeed = this.mileToKilometer( windSpeedInMiles ); var absoluteWindDir = this.rawWeatherData.currently.windBearing; this.highlights.windStatus.windDirection = absoluteWindDir; this.highlights.windStatus.derivedWindDirection = this.deriveWindDir( absoluteWindDir ); }, // top level for info section organizeCurrentWeatherInfo: function() { // data in this.currentWeather /* Coordinates and location is covered (get & set) in: — this.getCoordinates() — this.setFormatCoordinates() There are lots of async-await involved there. So it's better to keep them there. */ this.getSetCurrentTime(); this.getSetCurrentTemp(); this.getSetTodayTempHighLowWithTime(); this.getSetSummary(); this.getSetPossibility(); }, organizeTodayHighlights: function() { // top level for highlights this.getSetUVIndex(); this.getSetVisibility(); this.getSetWindStatus(); }, // topmost level orchestration organizeAllDetails: async function() { // top level organization await this.fetchWeatherData(); this.organizeCurrentWeatherInfo(); this.organizeTodayHighlights(); this.getSetHourlyTempInfoToday(); }, }, mounted: async function() { this.location = "New York"; await this.organizeAllDetails(); } }; </script>最後,經過如此多的耐心和辛勤工作,您可以看到具有原始力量的數據流! 在瀏覽器上訪問應用程序,刷新頁面,在應用程序的搜索框中搜索位置,然後按 Enter !
現在我們已經完成了所有繁重的工作,休息一下。 隨後的部分重點介紹使用數據創建美觀且信息豐富的圖表,然後使用 CSS 為我們醜陋的應用程序提供一個當之無愧的修飾會話。
5. FusionCharts 數據可視化
圖表的基本考慮
對於最終用戶而言,儀表板的本質本質上是這樣的:關於特定主題的過濾和精心策劃的信息的集合,通過視覺/圖形工具進行傳達,以便快速獲取。 他們不關心您的數據管道工程的微妙之處,也不關心您的代碼是否美觀——他們想要的只是 3 秒內的高級視圖。 因此,我們顯示文本數據的粗略應用程序對他們來說毫無意義,現在是我們實施用圖表包裝數據的機制的時候了。
然而,在我們深入研究圖表的實現之前,讓我們從我們的角度考慮一些相關的問題和可能的答案:
- 什麼類型的圖表適合我們正在處理的數據類型?
嗯,答案有兩個方面——背景和目的。 通過上下文,我們指的是數據的類型,它總體上適合更大事物的方案,受項目範圍和受眾的限制。 出於目的,我們本質上是指“我們想要強調什麼?”。 例如,我們可以使用柱形圖(等寬的垂直柱,高度與柱所代表的值成正比)來表示一天中不同時間的今天溫度。 但是,我們很少對單個值感興趣,而是對整個數據的整體變化和趨勢感興趣。 為了達到目的,使用折線圖符合我們的最大利益,我們很快就會這樣做。 - 在選擇圖表庫之前應該記住什麼?
由於我們正在做一個主要使用基於 JavaScript 的技術的項目,因此我們為項目選擇的任何圖表庫都應該是 JavaScript 世界的原生庫。 考慮到這個基本前提,在對任何特定庫進行歸零之前,我們應該考慮以下幾點:- 支持我們選擇的框架,在本例中是 Vue.js。 可以在其他流行的 JavaScript 框架(如 React 或 Angular)中開發項目 - 檢查圖表庫對您最喜歡的框架的支持。 此外,必須考慮支持其他流行的編程語言,如 Python、Java、C++、.Net(AS 和 VB),特別是當項目涉及一些嚴重的後端內容時。
- 圖表類型和功能的可用性,因為幾乎不可能事先知道項目中數據的最終形狀和用途(特別是如果您的客戶在專業環境中規定了要求)。 在這種情況下,您應該擴大您的網絡,並選擇一個擁有最廣泛圖表集合的圖表庫。 更重要的是,為了將您的項目與其他項目區分開來,該庫應具有足夠的可配置圖表屬性形式的功能,以便您可以微調和自定義圖表的大部分方面以及正確的粒度級別。 此外,默認圖表配置應該是合理的,並且庫文檔必須是一流的,原因對專業開發人員來說是顯而易見的。
- 還必須考慮學習曲線、支持社區和平衡,尤其是當您不熟悉數據可視化時。 一方面,您擁有像 Tableau 和 Qlickview 這樣的專有工具,這些工具成本高昂,學習曲線流暢,但在可定制性、集成和部署方面也有很多限制。 另一方面是 d3.js — 龐大、免費(開源),並且可以對其核心進行定制,但是您必須付出非常陡峭的學習曲線的代價才能使用該庫做任何有成效的事情。
您需要的是最佳點——生產力、覆蓋範圍、可定制性、學習曲線和課程外成本之間的正確平衡。 我們建議您查看 FusionCharts——世界上最全面的企業級 Web 和移動 JavaScript 圖表庫,我們將在本項目中使用它來創建圖表。
FusionCharts簡介
FusionCharts 在全球範圍內被遍布全球數百個國家的數百萬開發人員用作首選 JavaScript 圖表庫。 從技術上講,它盡可能地加載和配置,支持將它與幾乎所有用於基於 Web 的項目的流行技術堆棧集成。 在商業上使用 FusionCharts 需要許可證,您必鬚根據您的用例為許可證付費(如果您有興趣,請聯繫銷售人員)。 然而,我們在這個項目中使用 FusionCharts 只是為了嘗試一些東西,因此是非許可版本(在您的圖表中帶有一個小水印,以及一些其他限制)。 當您嘗試圖表並將其用於非商業或個人項目時,使用非許可版本非常好。 如果您有商業部署應用程序的計劃,請確保您擁有 FusionCharts 的許可。
由於這是一個涉及 Vue.js 的項目,如果之前沒有安裝,我們將需要安裝兩個模塊:
-
fusioncharts模塊,因為它包含創建圖表所需的一切 vue-fusioncharts模塊,本質上是對 fusioncharts 的封裝,因此可以在 Vue.js 項目中使用
如果您之前沒有安裝它們(如第三部分所述),請通過從項目的根目錄執行以下命令來安裝它們:
npm install fusioncharts vue-fusioncharts --save 接下來,確保項目的src/main.js文件有以下代碼(在第 3 節中也提到過):
import Vue from 'vue'; import App from './App.vue'; import FusionCharts from 'fusioncharts'; import Charts from 'fusioncharts/fusioncharts.charts'; import Widgets from 'fusioncharts/fusioncharts.widgets'; import PowerCharts from 'fusioncharts/fusioncharts.powercharts'; import FusionTheme from 'fusioncharts/themes/fusioncharts.theme.fusion'; import VueFusionCharts from 'vue-fusioncharts'; Charts(FusionCharts); PowerCharts(FusionCharts); Widgets(FusionCharts); FusionTheme(FusionCharts); Vue.use(VueFusionCharts, FusionCharts); new Vue({ el: '#app', render: h => h(App) })上述代碼段中最關鍵的行可能如下:
Vue.use(VueFusionCharts, FusionCharts)它指示 Vue 使用 vue-fusioncharts 模塊來理解項目中的許多東西,這些東西顯然不是我們明確定義的,而是在模塊本身中定義的。 此外,這種類型的聲明意味著全局聲明,我們的意思是 Vue 在我們項目的代碼中遇到任何奇怪的事情(我們沒有明確定義使用 FusionCharts 的事情),它至少會在 vue-fusioncharts 中查找一次和 fusioncharts 節點模塊的定義,然後再拋出錯誤。 如果我們在項目的一個孤立部分中使用 FusionCharts(而不是在幾乎所有組件文件中使用它),那麼本地聲明可能會更有意義。
這樣,您就可以在項目中使用 FusionCharts。 我們將使用多種圖表,選擇取決於我們想要可視化的天氣數據的方面。 此外,我們將看到數據綁定、自定義組件和觀察者在行動中的相互作用。
在.vue文件中使用 Fusioncharts 的一般方案
在本節中,我們將解釋使用 FusionCharts 在.vue文件中創建各種圖表的總體思路。 但首先,讓我們看一下示意性說明核心思想的偽代碼。
<template> <div> <fusioncharts :attribute_1="data_object_1" :attribute_2="data_object_2" … … ... > </fusioncharts> </div> </template> <script> export default { props: ["data_prop_received_by_the_component"], components: {}, data() { return { data_object_1: "value_1", data_object_2: "value_2", … … }; }, methods: {}, computed: {}, watch: { data_prop_received_by_the_component: { handler: function() { // some code/logic, mainly data manipulation based }, deep: true } } }; </script> <style> // component specific special CSS code here </style>讓我們了解一下上述偽代碼的不同部分:
- 在
<template>中,在頂級<div>(這對於每個組件的模板 HTML 代碼幾乎是強制性的),我們有自定義組件<fusioncharts>。 我們已經為這個項目安裝了vue-fusioncharts節點模塊中包含的組件的定義。 在內部,vue-fusioncharts依賴於fusioncharts模塊,該模塊也已安裝。 我們導入了必要的模塊並解決了它們的依賴關係,在src/main.js文件中指示 Vue 全局(整個項目)使用包裝器,因此我們使用的自定義<fusioncharts>組件不缺少定義這裡。 此外,自定義組件具有自定義屬性,並且每個自定義屬性都通過v-bind指令綁定到一個數據對象(以及它們的值),該指令的簡寫是冒號 (:) 符號。 當我們討論本項目中使用的一些特定圖表時,我們將更詳細地了解屬性及其關聯的數據對象。 - 在
<script>中,首先聲明組件應該接收的 props,然後繼續定義綁定到<fusioncharts>屬性的數據對象。 分配給數據對象的值是<fusioncharts>的屬性拉入的值,圖表是根據拉入的值創建的。 除此之外,代碼中最有趣的部分是watch { }對象。 這是 Vue 方案中的一個非常特殊的對象——它本質上指示 Vue 監視某些數據發生的任何變化,然後根據該數據的handler函數的定義方式採取行動。 例如,我們希望 Vue 監視接收到的prop,即偽代碼中的data_prop_received_by_the_component。prop成為watch { }對像中的一個鍵,而該鍵的值是另一個對象——一個處理方法,描述了當prop發生變化時需要做什麼。 通過這種優雅的機制來處理更改,應用程序保持其反應性。deep: true表示一個布爾標誌,您可以將其與觀察者相關聯,以便對正在觀察的對象進行相當深入的觀察,即甚至跟踪對象嵌套級別中所做的更改。
(更多關於watchers的信息,請查閱官方文檔)。
現在您已經了解了事物的一般方案,讓我們深入了解.vue組件文件中圖表的具體實現。 代碼將是不言自明的,您應該嘗試了解細節如何適合上述一般方案。
.vue 文件中圖表的實現
雖然實現的細節因圖表而異,但以下解釋適用於所有圖表:
-
<template>
如前所述,<fusioncharts>自定義組件有幾個屬性,每個屬性都通過使用v-bind: 指令綁定到data()函數中定義的相應數據對象。 屬性名稱的含義是不言自明的,找出相應的數據對像也很簡單。 -
<script>
在data()函數中,數據對象及其值是圖表工作的原因,因為<fusioncharts>的屬性上使用的v-bind(:) 指令完成了綁定。 在我們深入研究單個數據對象之前,值得一提的是一些一般特徵:- 值為
0或1的數據對象本質上是布爾值,其中0表示某些東西不可用/關閉,1表示可用/打開狀態。 但是,請注意非布爾數據對像也可以有0或1作為它們的值,除了其他可能的值——這取決於上下文。 例如,默認值為0的containerbackgroundopacity是布爾值,而默認值為0的lowerLimit僅表示數字零是其字面值。 - 一些數據對象處理 CSS 屬性,如邊距、填充、字體大小等——該值具有“px”或像素的隱含單位。 類似地,其他數據對象可以具有與其值關聯的隱式單位。 詳細信息請參考FusionCharts開發中心各自的圖表屬性頁面。
- 值為
- 在
data()函數中,也許最有趣和最不明顯的對像是 dataSource。 該對象具有嵌套在其中的三個主要對象:- chart :該對象封裝了很多與圖表的配置和修飾相關的圖表屬性。 它幾乎是一個強制性的結構,您會在您為此項目創建的所有圖表中找到它。
- colorrange :此對像在某種程度上特定於所考慮的圖表,主要出現在處理多種顏色/陰影的圖表中,以劃分圖表中使用的比例的不同子範圍。
- 值:此對象同樣存在於圖表中,該圖表具有需要在比例範圍內突出顯示的特定值。
-
watch { }對象可能是使該圖表以及該項目中使用的其他圖表栩栩如生的最關鍵的東西。 圖表的反應性,即圖表根據新用戶查詢產生的新值更新自身,由該對像中定義的觀察者控制。 例如,我們為組件接收到的 prophighlights定義了一個觀察者,然後定義了一個處理函數來指示 Vue 當整個項目中正在觀察的對象發生任何變化時它應該採取的必要行動。 這意味著每當App.vue為highlights中的任何對像生成新值時,信息都會一直向下傳遞到該組件,並且新值會在該組件的數據對像中更新。 綁定到值的圖表也會由於這種機製而更新。
上面的解釋是相當寬泛的筆觸,可以幫助我們對更大的圖景有一個直觀的理解。 一旦你直觀地理解了這些概念,你可以隨時查閱 Vue.js 和 FusionCharts 的文檔,當你從代碼本身不清楚的時候。 我們將練習留給您,從下一小節開始,我們將不再解釋我們在本小節中介紹的內容。
src/components/TempVarChart.vue
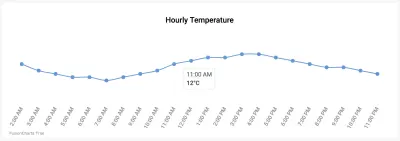
<template> <div class="custom-card header-card card"> <div class="card-body pt-0"> <fusioncharts type="spline" width="100%" height="100%" dataformat="json" dataEmptyMessage="i-https://i.postimg.cc/R0QCk9vV/Rolling-0-9s-99px.gif" dataEmptyMessageImageScale=39 :datasource="tempChartData" > </fusioncharts> </div> </div> </template> <script> export default { props: ["tempVar"], components: {}, data() { return { tempChartData: { chart: { caption: "Hourly Temperature", captionFontBold: "0", captionFontColor: "#000000", captionPadding: "30", baseFont: "Roboto", chartTopMargin: "30", showHoverEffect: "1", theme: "fusion", showaxislines: "1", numberSuffix: "°C", anchorBgColor: "#6297d9", paletteColors: "#6297d9", drawCrossLine: "1", plotToolText: "$label<br><hr><b>$dataValue</b>", showAxisLines: "0", showYAxisValues: "0", anchorRadius: "4", divLineAlpha: "0", labelFontSize: "13", labelAlpha: "65", labelFontBold: "0", rotateLabels: "1", slantLabels: "1", canvasPadding: "20" }, data: [], }, }; }, methods: { setChartData: function() { var data = []; for (var i = 0; i < this.tempVar.tempToday.length; i++) { var dataObject = { label: this.tempVar.tempToday[i].hour, value: this.tempVar.tempToday[i].temp }; data.push(dataObject); } this.tempChartData.data = data; }, }, mounted: function() { this.setChartData(); }, watch: { tempVar: { handler: function() { this.setChartData(); }, deep: true }, }, }; </script> <style> </style>src/components/UVIndex.vue
這個組件包含一個非常有用的圖表——角度計。
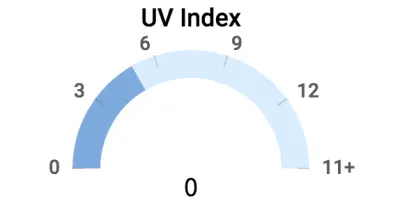
該組件的代碼如下所示。 有關 Angular Gauge 圖表屬性的詳細信息,請參閱 Angular Gauge 的 FusionCharts 開發中心頁面。
<template> <div class="highlights-item col-md-4 col-sm-6 col-xs-12 border-top"> <div> <fusioncharts :type="type" :width="width" :height="height" :containerbackgroundopacity="containerbackgroundopacity" :dataformat="dataformat" :datasource="datasource" ></fusioncharts> </div> </div> </template> <script> export default { props: ["highlights"], components: {}, data() { return { type: "angulargauge", width: "100%", height: "100%", containerbackgroundopacity: 0, dataformat: "json", datasource: { chart: { caption: "UV Index", captionFontBold: "0", captionFontColor: "#000000", captionPadding: "30", lowerLimit: "0", upperLimit: "15", lowerLimitDisplay: "1", upperLimitDisplay: "1", showValue: "0", theme: "fusion", baseFont: "Roboto", bgAlpha: "0", canvasbgAlpha: "0", gaugeInnerRadius: "75", gaugeOuterRadius: "110", pivotRadius: "0", pivotFillAlpha: "0", valueFontSize: "20", valueFontColor: "#000000", valueFontBold: "1", tickValueDistance: "3", autoAlignTickValues: "1", majorTMAlpha: "20", chartTopMargin: "30", chartBottomMargin: "40" }, colorrange: { color: [ { minvalue: "0", maxvalue: this.highlights.uvIndex.toString(), code: "#7DA9E0" }, { minvalue: this.highlights.uvIndex.toString(), maxvalue: "15", code: "#D8EDFF" } ] }, annotations: { groups: [ { items: [ { id: "val-label", type: "text", text: this.highlights.uvIndex.toString(), fontSize: "20", font: "Source Sans Pro", fontBold: "1", fillcolor: "#212529", x: "$gaugeCenterX", y: "$gaugeCenterY" } ] } ] }, dials: { dial: [ { value: this.highlights.uvIndex.toString(), baseWidth: "0", radius: "0", borderThickness: "0", baseRadius: "0" } ] } } }; }, methods: {}, computed: {}, watch: { highlights: { handler: function() { this.datasource.colorrange.color[0].maxvalue = this.highlights.uvIndex.toString(); this.datasource.colorrange.color[1].minvalue = this.highlights.uvIndex.toString(); this.datasource.annotations.groups[0].items[0].text = this.highlights.uvIndex.toString(); }, deep: true } } }; </script>src/components/Visibility.vue
在這個組件中,我們使用一個水平線性儀表來表示可見性,如下圖所示:
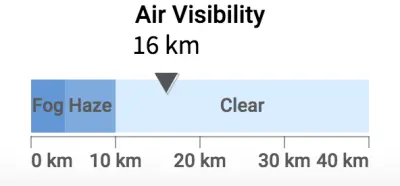
該組件的代碼如下所示。 要深入了解該圖表類型的不同屬性,請參閱 FusionCharts 開發中心頁面的水平線性儀表。
<template> <div class="highlights-item col-md-4 col-sm-6 col-xs-12 border-left border-right border-top"> <div> <fusioncharts :type="type" :width="width" :height="height" :containerbackgroundopacity="containerbackgroundopacity" :dataformat="dataformat" :datasource="datasource" > </fusioncharts> </div> </div> </template> <script> export default { props: ["highlights"], components: {}, methods: {}, computed: {}, data() { return { type: "hlineargauge", width: "100%", height: "100%", containerbackgroundopacity: 0, dataformat: "json", creditLabel: false, datasource: { chart: { caption: "Air Visibility", captionFontBold: "0", captionFontColor: "#000000", baseFont: "Roboto", numberSuffix: " km", lowerLimit: "0", upperLimit: "40", showPointerShadow: "1", animation: "1", transposeAnimation: "1", theme: "fusion", bgAlpha: "0", canvasBgAlpha: "0", valueFontSize: "20", valueFontColor: "#000000", valueFontBold: "1", pointerBorderAlpha: "0", chartBottomMargin: "40", captionPadding: "30", chartTopMargin: "30" }, colorRange: { color: [ { minValue: "0", maxValue: "4", label: "Fog", code: "#6297d9" }, { minValue: "4", maxValue: "10", label: "Haze", code: "#7DA9E0" }, { minValue: "10", maxValue: "40", label: "Clear", code: "#D8EDFF" } ] }, pointers: { pointer: [ { value: this.highlights.visibility.toString() } ] } } }; }, watch: { highlights: { handler: function() { this.datasource.pointers.pointer[0].value = this.highlights.visibility.toString(); }, deep: true } } }; </script>src/components/WindStatus.vue
該組件顯示風速和風向(風速,如果您精通物理學的話),並且很難使用圖表來表示矢量。 對於這種情況,我們建議使用一些漂亮的圖像和文本值來表示它們。 由於我們考慮的表示完全依賴於 CSS,我們將在下一節處理 CSS 中實現它。 但是,看看我們的目標是創造什麼:
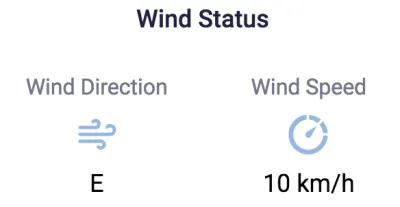
<template> <div class="highlights-item col-md-4 col-sm-6 col-xs-12 border-top"> <div> <div class="card-heading pt-5">Wind Status</div> <div class="row pt-4 mt-4"> <div class="col-sm-6 col-md-6 mt-2 text-center align-middle"> <p class="card-sub-heading mt-3">Wind Direction</p> <p class="mt-4"><img src="../assets/winddirection.svg" height="40" width="40"></p> <p class="card-value mt-4">{{ highlights.windStatus.derivedWindDirection }}</p> </div> <div class="col-sm-6 col-md-6 mt-2"> <p class="card-sub-heading mt-3">Wind Speed</p> <p class="mt-4"><img src="../assets/windspeed.svg" height="40" width="40"></p> <p class="card-value mt-4">{{ highlights.windStatus.windSpeed }} km/h</p> </div> </div> </div> </div> </template> <script> export default { props: ["highlights"], components: {}, data() { return {}; }, methods: {}, computed: {} }; </script>總結 Highlights.vue
回想一下,我們已經為所有組件實現了 CSS 代碼——除了Content.vue和Highlights.vue 。 由於Content.vue是一個只中繼數據的啞組件,它所需的最小樣式已經涵蓋。 此外,我們已經編寫了適當的代碼來設置側邊欄和包含圖表的卡片的樣式。 因此,我們剩下要做的就是在Highlights.vue中添加一些風格位,這主要涉及使用 CSS 類:
<template> <div class="custom-content-card content-card card"> <div class="card-body pb-0"> <div class="content-header h4 text-center pt-2 pb-3">Highlights</div> <div class="row"> <uv-index :highlights="highlights"></uv-index> <visibility :highlights="highlights"></visibility> <wind-status :highlights="highlights"></wind-status> </div> </div> </div> </template> <script> import UVIndex from "./UVIndex.vue"; import Visibility from "./Visibility.vue"; import WindStatus from "./WindStatus.vue"; export default { props: ["highlights"], components: { "uv-index": UVIndex, "visibility": Visibility, "wind-status": WindStatus, }, }; </script>部署和源代碼
按順序排列圖表和样式,我們就完成了! 花點時間欣賞您的創作之美。
現在是您部署應用程序並與同行共享的時候了。 如果您對部署不太了解並希望我們為您提供幫助,請在此處查看我們對部署想法的看法。 鏈接的文章還包含有關如何刪除每個圖表左下角的 FusionCharts 水印的建議。
如果你在某個地方搞砸了並想要一個參考點,可以在 Github 上找到源代碼。