使用 Angular Material 和 ng2-Charts 创建响应式仪表板
已发表: 2022-03-10从头开始创建仪表板通常非常复杂。 您必须创建工具来收集有关感兴趣项目的数据。 一旦收集到这些数据,就必须以易于理解和有意义的方式向您的用户呈现。 它涉及对包含哪些数据以及如何有效显示数据的复杂规划。 一旦制定了计划,实施设计就是一项艰巨的任务,尤其是因为它涉及构建多个组件。
使用 Angular Material 和 ng2-charts,您可以利用原理图来减少构建仪表板的工作量和时间。 Angular Material 附带了许多可用于生成仪表板的示意图。 同样,ng2-charts 提供了用于生成多个图表组件的示意图。 在本文中,我将说明如何使用 ng2-charts 和 Angular Material 来相当快速地设置仪表板。
一个例子
为了说明如何构建仪表板,我们将以销售包、钱包、钥匙扣等皮具的在线商店为例。 店主希望跟踪信息,例如客户从哪里来到他们的在线商店、他们的产品如何销售、流量来源与销售的关系等等。
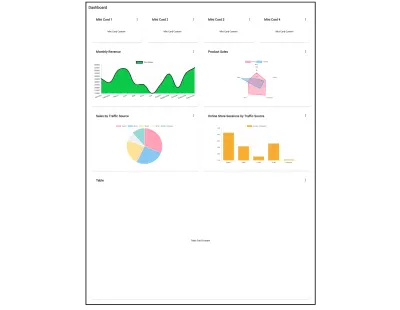
我们将构建一个仪表板来显示这些信息并帮助店主对其进行分析。 仪表板将包含四个小摘要卡、四种不同类型的图表和一个列出最近订单的表格。 四个汇总卡将显示销售总收入、平均订单价值、订单总数和回头客数量等信息。 这些图表将显示每种产品的销售量、流量来源的销售额、一段时间内的在线商店会话以及一周的销售额。
先决条件
要继续进行,您需要安装 Angular CLI。 如果您没有安装它,您可以在 cli.angular.io 找到如何获取它。 如果您不是从预先存在的 Angular 项目开始,则需要通过运行ng new <your project name>来生成一个。 例如,要为上述商店创建一个管理面板,我们将运行:
ng new store-admin-panel您的项目还需要为其配置路由。 如果您是从一个新应用程序开始,请在上面的项目设置过程中提示您是否添加 Angular Routing 模块时选择是。
将 Angular Material 和 Ng2-Charts 添加到您的项目中
Angular Material 附带了各种原理图,用于生成各种有用的组件,如地址簿、树、表格、导航等。 要将 Angular Material 添加到您的项目中,请运行:
ng add @angular/material从后续提示中提供的选项中选择一个主题。 接下来,系统会提示您选择是否添加 Angular Material 排版样式和浏览器动画。 你不需要这些,可以回答不。
接下来,您需要安装 ng2-charts。 ng2-charts 需要chart.js作为依赖项。 要安装 ng2-charts 运行:
npm install ng2-charts --save然后安装charts.js:
npm install chart.js --save 要访问图表,请将ChartsModule添加到AppModule的导入中。
import { ChartsModule } from 'ng2-charts'; @NgModule({ imports: [ … ChartsModule, … ] })最后,安装 ng2-charts 示意图作为开发依赖项,因为默认情况下它们不附带 ng2-charts。
npm install --save-dev ng2-charts-schematics生成导航组件
首先,我们需要添加一个导航组件来帮助用户舒适地浏览应用程序。 导航应该包含指向仪表板和其他页面的链接,这些页面将成为管理面板的一部分。 Angular 材料提供了生成导航组件的示意图。 我们将此组件命名为nav 。 通过运行以下命令完成向应用程序添加侧导航:
ng generate @angular/material:navigation nav 要链接导航中的其他路由,请使用routerLink指令并根据用户所在的路由更改工具栏中的页面名称。
// nav.component.ts ... menuItems = ['dashboard', 'sales', 'orders', 'customers', 'products']; <!--nav.component.html--> ... <mat-nav-list> <a *ngFor="let item of menuItems" mat-list-item [routerLink]="'/'+item"> {{item | titlecase}} </a> ... 要查看此组件,请将其添加到app.component.html 。
<!--app.component.html--> <app-nav></app-nav> 这就是NavComponent的样子。
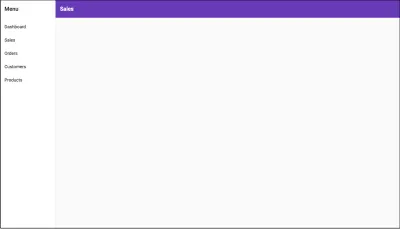
由于导航将与其他组件一起显示,因此向其添加router-outlet将有助于在其他不同组件之间切换。 在nav.component.html模板中,在关闭</mat-toolbar>之后,将<!-- Add Content Here -->注释替换为<router-outlet></router-outlet> 。
<!--nav.component.html--> <mat-sidenav-container> ... <mat-sidenav-content> <mat-toolbar> ... </mat-toolbar> <router-outlet></router-outlet> </mat-sidenav-content> </mat-sidenav-container>在本文后面的屏幕截图中,将省略此导航组件,以更好地突出显示我们将在本教程中生成的仪表板。 如果您在构建此仪表板时跟随,导航仍将如上图所示显示在您的浏览器中,其中包含仪表板。
生成仪表板
仪表板最重要的部分是它的布局。 它需要容纳前面提到的所有组件,并在不同设备上显示时做出响应。 要生成仪表板布局,您需要运行@angular/material:dashboard示意图。 它将生成一个响应式仪表板组件。 将仪表板的首选名称传递给原理图。 在这种情况下,我们将其命名为dash 。
ng generate @angular/material:dashboard dash要在 nav 组件中查看新生成的仪表板,请将其添加到路由器的路由。
// app-routing.module.ts import { DashComponent } from './dash/dash.component'; const routes: Routes = [{ path: 'dashboard', component: DashComponent }]; @NgModule({ imports: [RouterModule.forRoot(routes)], exports: [RouterModule] }) 完成后,要查看结果,运行npm start并前往localhost:4200/dashboard 。 你应该看到这个:
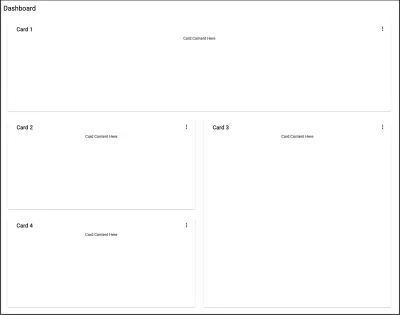
原理图在模板中生成四张卡片,并将它们显示在响应式网格中。 Angular Material CDK 使用Layout包来设置这个响应式卡片网格的样式。 Layout包的BreakpointObserver实用程序评估媒体查询并根据它们进行 UI 更改。 有各种可用的断点,但在生成的组件中,只满足两个类别。 Breakpoints.Handset和其他不匹配的查询。 Layout包指定了 14 个断点状态,您可以使用它们来自定义仪表板的响应能力。
// dashboard.component.js ... cards = this.breakpointObserver.observe(Breakpoints.Handset).pipe( map(({ matches }) => { if (matches) { ... } ... }) ); 回到仪表板,由于仪表板上将有四张摘要卡、四张图表和一张表格,我们总共需要九张卡片。 Breakpoints.Handset和Breakpoints.Tablet匹配项将显示在单列网格中,其中:
- 四张摘要卡将跨越一排。
- 图表将跨越两行。
- 该表将跨越四行。
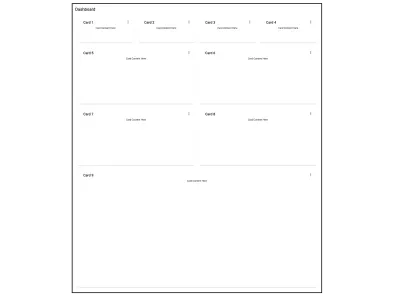
非Breakpoints.Handset和非Breakpoints.Tablet匹配项将显示在四列中,其中:
- 四个摘要卡将跨越一行一列。
- 图表将跨越两行和两列。
- 该表将跨越四行四列。
在非Breakpoints.Handset和非Breakpoints.Tablet匹配中,它应该类似于下面的屏幕截图。 在Breakpoints.Handset和Breakpoints.Tablet匹配时,所有内容都将仅显示在一列中。
创建卡片组件
在仪表板组件中,所有卡片都是通过迭代生成的。 为了防止重复,在添加所有新组件时,我们将创建一个可重用的卡片组件。 卡片组件将接受标题作为输入,并使用ng-content动态添加其余内容。 要创建卡片组件,请运行:
ng gc card -m app --style css 从仪表板组件模板中,我们只需将<mat-card>标记中包含的标记放入卡片模板中:
<!--card.component.html--> <mat-card class="dashboard-card"> <mat-card-header> <mat-card-title> {{title}} <button mat-icon-button class="more-button" [matMenuTriggerFor]="menu" aria-label="Toggle menu"> <mat-icon>more_vert</mat-icon> </button> <mat-menu #menu="matMenu" xPosition="before"> <button mat-menu-item>Expand</button> <button mat-menu-item>Remove</button> </mat-menu> </mat-card-title> </mat-card-header> <mat-card-content class="dashboard-card-content"> <ng-content></ng-content> </mat-card-content> </mat-card>要将标题作为输入添加到卡片:
// card.component.ts import { Component, Input } from '@angular/core'; ... export class CardComponent{ @Input() title: string; ... }设置卡片样式:
/*card.component.css*/ .more-button { position: absolute; top: 5px; right: 10px; } .dashboard-card { position: absolute; top: 15px; left: 15px; right: 15px; bottom: 15px; } .dashboard-card-content { text-align: center; flex-grow: 1; display: flex; flex-direction: column; align-items: center; max-height: 100%; justify-content: center; align-items: stretch; } mat-card { display: flex; flex-direction: column; }将卡片添加到仪表板
由于仪表板元素将单独添加而不是通过迭代添加,因此需要修改仪表板组件以解决此问题。 在dashboard.component.ts中,移除cards属性并将其替换为cardLayout属性。 cardLayout变量将定义材料网格列表的列数以及每个仪表板卡将跨越多少行和列。 Breakpoints.Handset和Breakpoints.Tablet查询匹配将显示在 1 列中,不匹配的将显示在 4 列中。
// dashboard.component.js ... cardLayout = this.breakpointObserver.observe(Breakpoints.Handset).pipe( map(({ matches }) => { if (matches) { return { columns: 1, miniCard: { cols: 1, rows: 1 }, chart: { cols: 1, rows: 2 }, table: { cols: 1, rows: 4 }, }; } return { columns: 4, miniCard: { cols: 1, rows: 1 }, chart: { cols: 2, rows: 2 }, table: { cols: 4, rows: 4 }, }; }) ); ... 在dash.component.html模板中,替换mat-grid-tile元素的colspan和rowspan值以及 mat mat-grid-list元素的cols属性。
<!--dash.component.html--> <div class="grid-container"> <h1 class="mat-h1">Dashboard</h1> <mat-grid-list cols="{{ ( cardLayout | async )?.columns }}" rowHeight="200px"> <!--Mini Cards--> <mat-grid-tile *ngFor="let i of [1, 2, 3, 4]" [colspan]="( cardLayout | async )?.miniCard.cols" [rowspan]="( cardLayout | async )?.miniCard.rows"> <app-card title="Card {{i}}"><div>Mini Card Content Here</div></app-card> </mat-grid-tile> <!--Charts--> <mat-grid-tile *ngFor="let i of [5, 6, 7, 8]" [colspan]="( cardLayout | async )?.chart.cols" [rowspan]="( cardLayout | async )?.chart.rows"> <app-card title="Card {{i}}"><div>Chart Content Here</div></app-card> </mat-grid-tile> <!--Table--> <mat-grid-tile [colspan]="( cardLayout | async )?.table.cols" [rowspan]="( cardLayout | async )?.table.rows"> <app-card title="Card 9"><div>Table Content Here</div></app-card> </mat-grid-tile> </mat-grid-list> </div>仪表板最终看起来与上面链接的最新屏幕截图完全相同。
生成图表
仪表板需要的四个图表是:
- 按销售单位划分的产品雷达图。
- 按流量来源的销售额饼图。
- 在线商店会话的条形图。
- 全年销售折线图。
与创建仪表板类似,生成图表组件涉及运行原理图。 使用 ng2-charts 原理图,生成四个不同的图表。 我们将它们放在一个名为charts 的文件夹中。 运行ng generate ng2-charts-schematics:<chart type> <chart name> 。
ng generate ng2-charts-schematics:radar charts/product-sales-chart ng generate ng2-charts-schematics:pie charts/sales-traffic-chart ng generate ng2-charts-schematics:line charts/annual-sales-chart ng generate ng2-charts-schematics:bar charts/store-sessions-chart 运行这些命令后,将生成所有四个图表组件并填充准备显示的示例数据。 根据您要显示的数据,选择最适合您的数据可视化需求的图表。 对于上面生成的每个图表,将chartContainer类添加到图表模板中包含canvas元素的div中。
<div class="chartContainer"> <canvas baseChart width="400" height="400"> ... 接下来,将此样式添加到styles.css以便所有图表组件都可以访问它们。
/*styles.css*/ ... .chartContainer canvas { max-height: 250px; width: auto; } .chartContainer{ height: 100%; display: flex; flex-direction: column; align-items: center; justify-content: center; }向图表添加数据
生成的图表组件附带已插入的示例数据。如果您有提供自己数据的预先存在的服务,您可以将这些数据从它们添加到图表组件中。 图表采用 x 轴、数据或数据集、图表类型、颜色、图例以及其他自定义选项的标签。 要为图表提供数据和标签,请创建一个服务,该服务将从您选择的来源获取数据并以图表接受的形式返回数据。 例如, AnnualSalesChartComponent从SalesService的getSalesByMonth方法接收其数据集和标签,该方法返回当年每个月的销售额数组。 您可以在此处找到此服务并在此处找到它返回的数据。 将服务作为私有属性注入到AnnualSalesChartComponent构造函数中。 在ngOnInit生命周期挂钩中调用从服务返回所需图表数据的方法。
// annual-sales-chart.component.ts import { SalesService } from 'src/app/sales/sales.service'; ... export class AnnualSalesChartComponent implements OnInit { public salesChartData: ChartDataSets[] = [ { data: [], label: 'Total Sales' }, ]; public salesChartLabels: Label[] = []; ... constructor(private salesService: SalesService) { } ngOnInit() { this.salesService.getSalesByMonth().subscribe({ next: salesItems => { salesItems.forEach(li => { this.salesChartData[0].data.push(li.revenue); this.salesChartLabels.push(li.month); }); }, ... }); } }将图表添加到仪表板
下一步涉及在dash.component.html图表添加到仪表板。 看起来是这样的:
<!--dash.component.html--> ... <!--Charts--> <mat-grid-tile [colspan]="( cardLayout | async )?.chart.cols" [rowspan]="( cardLayout | async )?.chart.rows"> <app-card title="Monthly Revenue"> <app-annual-sale-chart></app-annual-sale-chart> </app-card> </mat-grid-tile> <mat-grid-tile [colspan]="( cardLayout | async )?.chart.cols" [rowspan]="( cardLayout | async )?.chart.rows"> <app-card title="Product Sales"> <app-product-sales-chart></app-product-sales-chart> </app-card> </mat-grid-tile> <mat-grid-tile [colspan]="( cardLayout | async )?.chart.cols" [rowspan]="( cardLayout | async )?.chart.rows"> <app-card title="Sales by Traffic Source"> <app-sales-traffic-chart></app-sales-traffic-chart> </app-card> </mat-grid-tile> <mat-grid-tile [colspan]="( cardLayout | async )?.chart.cols" [rowspan]="( cardLayout | async )?.chart.rows"> <app-card title="Online Store Sessions by Traffic Source"> <app-store-sessions-chart></app-store-sessions-chart> </app-card> </mat-grid-tile> ...这就是生成的响应式仪表板的样子。

生成表
我们将添加一个订单表,为店主提供最近下达的订单及其状态的概览。 要生成订单表组件,请运行原理图:
ng generate @angular/material:table orders-table这将生成一个看起来像这样的表格组件。
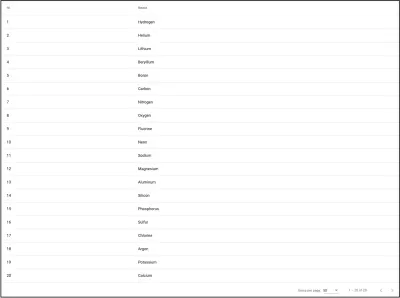
具有许多列的表格可能难以响应手机和平板电脑的视图。 将表格添加到卡片时,使其可水平滚动,以便所有数据都可以正常查看且不受阻碍。 您可以通过将以下样式添加到表格组件来做到这一点:
<!--table.component.html--> <div class="mat-elevation-z8 small-table"> <table mat-table class="full-width-table" matSort aria-label="Elements"> ... /*table.component.css*/ ... .small-table{ overflow-x: scroll !important; }要将表格添加到破折号组件:
<!-- dashboard.component.html> ... <mat-grid-tile [colspan]="( cardLayout | async )?.table.cols" [rowspan]="( cardLayout | async )?.table.rows"> <app-card title="Latest Orders"> <app-orders-table></app-orders-table> </app-card> </mat-grid-tile> ...向表中添加数据
与图表一样,您可以通过服务的ngOnInit方法将数据添加到表中。 此外,您将需要修改表的生成数据源以使用服务中的数据。 首先,在表的类构造函数中注入服务。 让我们以列出此仪表板最新订单的表格为例。 要获取表格的数据,让我们在OrdersTableComponent构造函数中注入OrderService ,更改表格视图子视图的MatTable类型断言,并修改显示的列列表以反映订单界面。 如果您对添加到表中的数据感兴趣,可以在此处找到。 最后一件事涉及获取可用于在表的<mat-paginator>中设置总数的数据项的总长度。
// orders-table.component.ts import { OrderService } from '../orders.service'; import { Order } from '../order'; ... export class OrdersTableComponent implements AfterViewInit, OnInit { ... @ViewChild(MatTable) table: MatTable ; dataLength: number; displayedColumns = [ "id", "date", "name", "status", "orderTotal", "paymentMode", ]; ... constructor(private orderService: OrderService){} ngOnInit() { this.datasource = new OrdersTableDataSource(this.orderService); this.orderService.getOrderCount().subscribe({ next: orderCount => { this.dataLength = orderCount; }, ... }); } ... }// orders-table.component.ts import { OrderService } from '../orders.service'; import { Order } from '../order'; ... export class OrdersTableComponent implements AfterViewInit, OnInit { ... @ViewChild(MatTable) table: MatTable ; dataLength: number; displayedColumns = [ "id", "date", "name", "status", "orderTotal", "paymentMode", ]; ... constructor(private orderService: OrderService){} ngOnInit() { this.datasource = new OrdersTableDataSource(this.orderService); this.orderService.getOrderCount().subscribe({ next: orderCount => { this.dataLength = orderCount; }, ... }); } ... }
接下来,我们需要修改OrdersTableDataSource类以在其构造函数中接受OrderService作为参数。 我们还必须修改它的connect和destroy方法。 connect方法将数据源连接到表,并在从它返回的流(在本例中为可观察的订单数组)发出新数据项时更新表。 dataMutations常量将第一个数据加载、分页和排序事件组合到一个流中供表使用。 分页和排序由OrderService服务器端处理。 所以我们需要将分页器的偏移量和页面大小以及排序属性的活动排序字段和排序方向传递给OrderService的getOrders方法。 disconnect方法应该用于关闭任何已建立的连接并释放在 connect 方法中占用的资源。
// orders-table.datasource.ts ... export class OrdersTableDataSource extends DataSource<Order> { paginator: MatPaginator; sort: MatSort; constructor(private orderService: OrderService) { super(); } connect(): Observable<Order[]> { const dataMutations = [ of('Initial load'), this.paginator.page, this.sort.sortChange ]; return merge(...dataMutations).pipe(mergeMap(() => { return this.orderService.getOrders( this.paginator.pageIndex * this.paginator.pageSize, this.paginator.pageSize, this.sort.active, this.sort.direction ); })); } disconnect() {} } 在订单表模板中,插入新列并将<mat-paginator>的length属性绑定到dataLength属性。 对于状态列,使用<mat-chip>元素可以更好地显示订单状态。 要访问<mat-chip> ,请将MatChipsModule作为导入添加到AppModule 。
<!-- orders-table.component.html --> <div class="mat-elevation-z8"> <table mat-table class="full-width-table" matSort aria-label="Elements"> <!-- Id Column --> <ng-container matColumnDef="id"> <th mat-header-cell *matHeaderCellDef mat-sort-header>Id</th> <td mat-cell *matCellDef="let row">{{row.id}}</td> </ng-container> <!-- Date Column --> <ng-container matColumnDef="date"> <th mat-header-cell *matHeaderCellDef mat-sort-header>Date</th> <td mat-cell *matCellDef="let row">{{row.date | date }}</td> </ng-container> <!-- Name Column --> <ng-container matColumnDef="name"> <th mat-header-cell *matHeaderCellDef mat-sort-header>Name</th> <td mat-cell *matCellDef="let row">{{row.name}}</td> </ng-container> <!-- Order Total Column --> <ng-container matColumnDef="orderTotal"> <th mat-header-cell *matHeaderCellDef mat-sort-header>Order Total</th> <td mat-cell *matCellDef="let row">{{row.orderTotal | currency}}</td> </ng-container> <!-- Payment Mode Column --> <ng-container matColumnDef="paymentMode"> <th mat-header-cell *matHeaderCellDef mat-sort-header>Payment Mode</th> <td mat-cell *matCellDef="let row">{{row.paymentMode}}</td> </ng-container> <!-- Status Column --> <ng-container matColumnDef="status"> <th mat-header-cell *matHeaderCellDef mat-sort-header>Status</th> <td mat-cell *matCellDef="let row"> <mat-chip-list> <mat-chip color="{{ row.status == 'delivered' ? 'primary' : ( row.status == 'shipped' ? 'accent' : 'warn' ) }}" selected> {{row.status}} </mat-chip> </mat-chip-list> </td> </ng-container> <tr mat-header-row *matHeaderRowDef="displayedColumns"></tr> <tr mat-row *matRowDef="let row; columns: displayedColumns;"></tr> </table> <mat-paginator #paginator [length]="dataLength" [pageIndex]="0" [pageSize]="5" [pageSizeOptions]="[5, 10, 15, 20]"> </mat-paginator> </div>将数据添加到表中后,仪表板将如下所示:
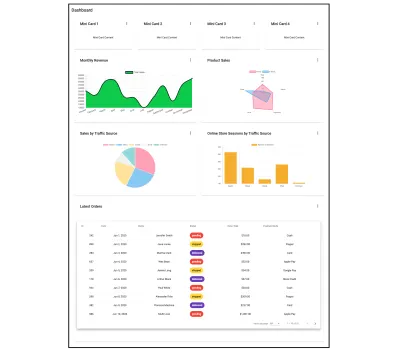
创建迷你卡组件
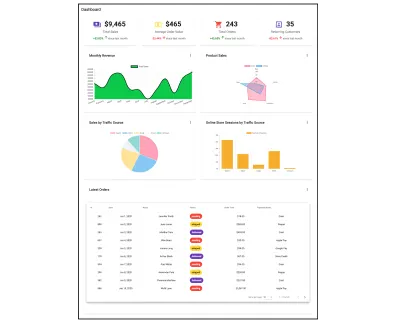
完成仪表板剩下的就是填充位于顶部的四张小卡片。 将较小的摘要卡作为仪表板的一部分可以轻松突出显示不需要整个图表或表格的简短信息。 在此示例中,四张迷你卡片将显示总销售额、平均订单价值、订单总数以及当天光顾商店的回头客数量。 这只是一个例子。 这些迷你卡片无法像导航、仪表板布局、图表和表格那样生成。 他们没有原理图。 下面我们将简要介绍如何创建它们。 虽然我们将添加特定于示例的数据,但您可以添加任何您想要的内容或决定完全取消它们。 首先,生成mini-card组件,运行:
ng gc mini-card -m app --style css 您可以在此处找到链接的组件的模板及其样式。 该组件有八个输入属性,您可以在此处了解如何添加它们。 要向迷你卡组件获取数据,请在DashComponent构造函数中注入为它们提供数据的服务。 将从服务接收到的数据分配给DashComponent的属性。 在本例中,我们将从StoreSummaryService获取数据并将其分配给miniCardData属性。 这是如何做:
// dash.component.ts export class DashComponent implements OnInit{ ... miniCardData: StoreSummary[]; constructor(private breakpointObserver: BreakpointObserver, private summaryService: StoreSummaryService) {} ngOnInit() { this.summaryService.getStoreSummary().subscribe({ next: summaryData => { this.miniCardData = summaryData; } }); } } 要将mini-cards添加到仪表板组件并使用来自服务的数据填充它们:
<!--dash.component.html--> ... <!--Mini Cards--> <mat-grid-tile *ngFor="let mc of miniCardData" [colspan]="( cardLayout | async )?.miniCard.cols" [rowspan]="( cardLayout | async )?.miniCard.rows"> <app-mini-card [title]="mc.title" [textValue]="mc.textValue" [value]="mc.value" [color]="mc.color" [percentValue]="mc.percentValue"></app-mini-card> </mat-grid-tile> ...下面的屏幕截图是填充了迷你卡的仪表板的样子。
放在一起
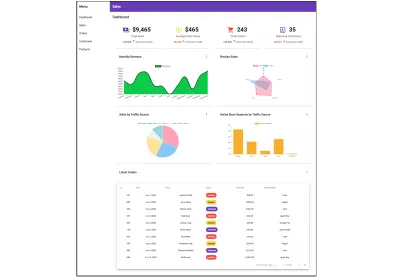
最后,仪表板组件模板应包含:
<!-- dashboard.component.html --> <div class="grid-container"> <h1 class="mat-h1">Dashboard</h1> <mat-grid-list cols="{{ ( cardLayout | async )?.columns }}" rowHeight="200px"> <!--Mini Cards--> <mat-grid-tile *ngFor="let mc of miniCardData" [colspan]="( cardLayout | async )?.miniCard.cols" [rowspan]="( cardLayout | async )?.miniCard.rows"> <app-mini-card [icon]="mc.icon" [title]="mc.title" [value]="mc.value" [color]="mc.color" [isIncrease]="mc.isIncrease" duration="since last month" [percentValue]="mc.percentValue" [isCurrency]="mc. isCurrency"></app-mini-card> </mat-grid-tile> <!--Charts--> <mat-grid-tile [colspan]="( cardLayout | async )?.chart.cols" [rowspan]="( cardLayout | async )?.chart.rows"> <app-card title="Monthly Revenue"> <app-annual-sale-chart></app-annual-sale-chart> </app-card> </mat-grid-tile> <mat-grid-tile [colspan]="( cardLayout | async )?.chart.cols" [rowspan]="( cardLayout | async )?.chart.rows"> <app-card title="Product Sales"> <app-product-sales-chart></app-product-sales-chart> </app-card> </mat-grid-tile> <mat-grid-tile [colspan]="( cardLayout | async )?.chart.cols" [rowspan]="( cardLayout | async )?.chart.rows"> <app-card title="Sales by Traffic Source"> <app-sales-traffic-chart></app-sales-traffic-chart> </app-card> </mat-grid-tile> <mat-grid-tile [colspan]="( cardLayout | async )?.chart.cols" [rowspan]="( cardLayout | async )?.chart.rows"> <app-card title="Online Store Sessions by Traffic Source"> <app-store-sessions-chart></app-store-sessions-chart> </app-card> </mat-grid-tile> <!--Table--> <mat-grid-tile [colspan]="( cardLayout | async )?.table.cols" [rowspan]="( cardLayout | async )?.table.rows"> <app-card title="Latest Orders"> <app-orders-table></app-orders-table> </app-card> </mat-grid-tile> </mat-grid-list> </div>这是生成的仪表板包含的内容。
结论
创建仪表板涉及大量工作和计划。 加快构建速度的一种方法是使用 Angular Material 和 ng2-charts 提供的各种示意图。 使用这些示意图,运行命令将生成一个完整的组件,并且可以使仪表板快速启动并运行。 这让您有更多时间专注于创建数据服务并将它们添加到仪表板组件中。
如果您想了解更多关于 Angular Material 提供的一些原理图,请访问 material.angular.io,对于 ng2-charts 提供的那些,请访问此处链接的他们的网站。
