
Vue.js를 사용하여 API로 대화형 날씨 대시보드 만들기
게시 됨: 2022-03-10(이 기사는 후원 기사입니다.) 이 튜토리얼에서는 처음부터 간단한 날씨 대시보드를 구축합니다. "Hello World" 예제가 아니며 크기와 복잡성이 너무 위협적이지 않은 클라이언트 끝 응용 프로그램이 될 것입니다.
전체 프로젝트는 Node.js + npm 생태계의 도구를 사용하여 개발됩니다. 특히, 우리는 데이터를 위한 Dark Sky API, 모든 무거운 작업을 위한 Vue.js, 데이터 시각화를 위한 FusionCharts에 크게 의존할 것입니다.
전제 조건
다음 사항을 숙지하시기 바랍니다.
- HTML5 및 CSS3 (Bootstrap에서 제공하는 기본 기능도 사용할 것입니다.
- JavaScript (특히 ES6 언어 사용 방식)
- Node.js 및 npm (환경 및 패키지 관리의 기본 사항은 괜찮습니다).
위에서 언급한 것 외에도 Vue.js 또는 기타 유사한 JavaScript 프레임워크에 익숙하다면 좋을 것입니다. 우리는 당신이 FusionCharts 에 대해 알고 있을 것이라고 기대하지 않습니다. 사용하기가 너무 쉬워 즉시 배울 수 있습니다!
기대되는 학습
이 프로젝트의 주요 학습 내용은 다음과 같습니다.
- 좋은 대시보드 구현을 계획하는 방법
- Vue.js로 애플리케이션을 개발하는 방법
- 데이터 기반 애플리케이션을 만드는 방법
- FusionCharts를 사용하여 데이터를 시각화하는 방법
특히 각 섹션에서는 학습 목표에 한 걸음 더 다가갈 수 있습니다.
- 날씨 대시보드 소개
이 장에서는 사업의 다양한 측면에 대한 개요를 제공합니다. - 프로젝트 만들기
이 섹션에서는 Vue 명령줄 도구를 사용하여 처음부터 프로젝트를 만드는 방법을 배웁니다. - 기본 프로젝트 구조 사용자 정의
이전 섹션에서 얻은 기본 프로젝트 스캐폴딩으로는 충분하지 않습니다. 여기에서 구조적 관점에서 프로젝트에 필요한 추가 항목을 배웁니다. - 데이터 수집 및 처리
이 섹션은 프로젝트의 핵심입니다. API에서 데이터를 수집하고 처리하기 위한 모든 중요한 코드가 여기에 표시됩니다. 이 섹션에서 최대 시간을 보낼 것으로 예상됩니다. - FusionChart를 사용한 데이터 시각화
프로젝트의 모든 데이터와 움직이는 부분이 안정화되면 이 섹션에서는 FusionCharts와 약간의 CSS를 사용하여 데이터를 시각화하는 데 전념합니다.
1. 대시보드 워크플로
구현을 시작하기 전에 계획을 명확히 하는 것이 중요합니다. 우리는 계획을 4가지 측면으로 나눕니다.
요구 사항
이 프로젝트에 대한 요구 사항은 무엇입니까? 즉, 날씨 대시보드를 통해 보여주고 싶은 것은 무엇일까요? 우리의 의도된 청중은 아마도 단순한 취향을 가진 인간일 수 있다는 점을 염두에 두고 다음을 보여드리고자 합니다.
- 날씨에 대한 몇 가지 기본 정보와 함께 날씨를 보고자 하는 위치의 세부정보입니다. 엄격한 요구 사항이 없기 때문에 지루한 세부 사항은 나중에 알아 보겠습니다. 그러나 이 단계에서 청중이 관심 위치에 대한 정보를 제공할 수 있도록 검색 상자를 제공해야 한다는 점에 유의하는 것이 중요합니다.
- 다음과 같은 관심 위치의 날씨에 대한 그래픽 정보:
- 조회일의 온도 변화
- 오늘 날씨의 하이라이트:
- 풍속 및 방향
- 시계
- 자외선 지수
참고 : API에서 얻은 데이터는 날씨의 다른 많은 측면에 대한 정보를 제공합니다. 우리는 코드를 최소한으로 유지하기 위해 그것들을 모두 사용하지 않기로 선택했습니다.
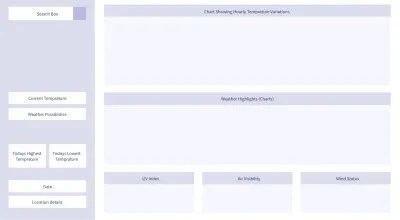
구조
요구 사항에 따라 아래와 같이 대시보드를 구성할 수 있습니다.
데이터
적절한 데이터 없이는 멋진 시각화가 없기 때문에 대시보드는 얻은 데이터만큼 좋습니다. 날씨 데이터를 제공하는 많은 공개 API가 있습니다. 그 중 일부는 무료이고 일부는 그렇지 않습니다. 우리 프로젝트의 경우 Dark Sky API에서 데이터를 수집합니다. 그러나 클라이언트 측에서 직접 API 엔드포인트를 폴링할 수는 없습니다. 걱정하지 마세요. 적절한 시기에 공개될 해결 방법이 있습니다! 검색된 위치에 대한 데이터를 얻은 후에는 일부 데이터 처리 및 형식 지정을 수행합니다. 아시다시피 청구서 지불에 도움이 되는 기술 유형입니다.
심상
깨끗하고 형식이 지정된 데이터를 얻으면 FusionCharts에 연결합니다. FusionCharts만큼 유능한 JavaScript 라이브러리는 전 세계에 거의 없습니다. FusionCharts의 방대한 제품 중에서 우리는 몇 가지만 사용할 것입니다. 모두 JavaScript로 작성되었지만 FusionCharts용 Vue 래퍼와 통합될 때 원활하게 작동합니다.
더 큰 그림으로 무장하고 손을 더럽혀 봅시다. 이제 일을 구체화할 때입니다! 다음 섹션에서는 기본 Vue 프로젝트를 만들고 그 위에 추가로 빌드합니다.
2. 프로젝트 생성
프로젝트를 생성하려면 다음 단계를 실행하십시오.
- Node.js + npm 설치
( 컴퓨터에 Node.js가 설치되어 있다면 이 단계를 건너뛰세요. )
Node.js에는 npm이 번들로 제공되므로 npm을 별도로 설치할 필요가 없습니다. 운영 체제에 따라 여기에 제공된 지침에 따라 Node.js를 다운로드하여 설치합니다.
일단 설치되면 소프트웨어가 올바르게 작동하는지, 그리고 버전이 무엇인지 확인하는 것이 좋습니다. 이를 테스트하려면 명령줄/터미널을 열고 다음 명령을 실행합니다.node --version npm --version - npm으로 패키지 설치
npm을 실행하고 다음 명령을 실행하여 프로젝트에 필요한 기본 패키지를 설치합니다.npm install -g vue@2 vue-cli@2 -
vue-cli로 프로젝트 스캐폴딩 초기화
이전 단계가 모두 잘 진행되었다고 가정하면 다음 단계는 Vue.js의 명령줄 도구인vue-cli를 사용하여 프로젝트를 초기화하는 것입니다. 그렇게 하려면 다음을 실행하십시오. - webpack-simple 템플릿으로 스캐폴딩을 초기화합니다.
많은 질문을 받게 될 것입니다. 마지막 질문을 제외하고 모두 기본값을 수락하면 이 프로젝트에 충분할 것입니다. 마지막에vue init webpack-simple vue_weather_dashboardN이라고 답하세요.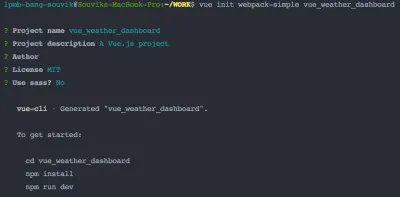
(큰 미리보기) webpack-simple은 빠른 프로토타이핑 및 우리와 같은 가벼운 응용 프로그램에 탁월하지만 심각한 응용 프로그램이나 프로덕션 배포에는 특히 적합하지 않습니다. 다른 템플릿을 사용하고 싶거나(초보자인 경우 권장하지 않음) 프로젝트 이름을 다른 것으로 지정하려는 경우 구문은 다음과 같습니다.vue init [template-name] [project-name] - 프로젝트에 대해 vue-cli가 생성한 디렉토리로 이동합니다.
cd vue_weather_dashboard -
webpack-simple템플릿용vue-cli도구로 생성된package.json에 언급된 모든 패키지를 설치합니다.npm install - 개발 서버를 시작하고 브라우저에서 작동하는 기본 Vue 프로젝트를 확인하십시오!
npm run dev
Vue.js를 처음 사용하는 경우 잠시 시간을 내어 최신 업적을 음미하세요. 작은 Vue 애플리케이션을 만들고 localhost:8080에서 실행 중입니다!

기본 프로젝트 구조에 대한 간략한 설명
이제 vue_weather_dashboard 디렉토리 내부의 구조를 살펴보고 수정을 시작하기 전에 기본 사항을 이해할 수 있습니다.
구조는 다음과 같습니다.
vue_weather_dashboard |--- README.md |--- node_modules/ | |--- ... | |--- ... | |--- [many npm packages we installed] | |--- ... | |--- ... |--- package.json |--- package-lock.json |--- webpack.config.js |--- index.html |--- src | |--- App.vue | |--- assets | | |--- logo.png | |--- main.js기본 파일과 디렉토리에 익숙해지는 것을 건너뛰고 싶을 수도 있지만 Vue가 처음이라면 최소한 파일의 내용을 살펴보는 것이 좋습니다 . 이것은 좋은 교육 세션이 될 수 있으며 특히 다음 파일과 같이 스스로 추구해야 하는 질문을 유발할 수 있습니다.
-
package.json, 사촌package-lock.json살펴보기 -
webpack.config.js -
index.html -
src/main.js -
src/App.vue
트리 다이어그램에 표시된 각 파일 및 디렉토리에 대한 간략한 설명은 다음과 같습니다.
- README.md
추측에 대한 보상 없음 — 주로 인간이 프로젝트 스캐폴딩을 만드는 데 필요한 단계를 읽고 이해하는 것입니다. - node_modules/
이것은 npm이 프로젝트를 킥스타트하는 데 필요한 패키지를 다운로드하는 디렉토리입니다. 필요한 패키지에 대한 정보는package.json파일에서 확인할 수 있습니다. - 패키지.json
이 파일은webpack-simple템플릿의 요구 사항을 기반으로 vue-cli 도구에 의해 생성되며 설치해야 하는 npm 패키지(해당 버전 및 기타 세부 정보 포함)에 대한 정보를 포함합니다. 이 파일의 내용을 자세히 살펴보십시오. 여기를 방문하여 프로젝트에 필요한 패키지를 추가/삭제하기 위해 편집한 다음 npm install을 실행해야 합니다. 여기에서package.json에 대해 자세히 읽어보세요. - 패키지 잠금.json
이 파일은 npm 자체에 의해 생성되며 주로 npm이 다운로드 및 설치한 항목의 로그를 유지하기 위한 것입니다. - 웹팩.config.js
이것은 webpack의 구성을 포함하는 JavaScript 파일입니다. 프로젝트의 다양한 측면(코드, 정적 자산, 구성, 환경, 사용 모드 등)을 함께 묶고 사용자에게 제공하기 전에 축소하는 도구입니다. 이점은 모든 것이 자동으로 연결되고 응용 프로그램의 성능이 향상되어 사용자 경험이 크게 향상된다는 것입니다(페이지가 빠르게 제공되고 브라우저에서 더 빨리 로드됨). 나중에 보게 되겠지만, 이것은 빌드 시스템의 어떤 것이 의도한 대로 작동하지 않을 때 검사해야 하는 파일입니다. 또한 응용 프로그램을 배포하려는 경우 편집해야 하는 주요 파일 중 하나입니다(자세한 내용은 여기 참조). - index.html
이 HTML 파일은 데이터와 코드가 동적으로 포함되어야 하는(Vue가 주로 하는 일) 사용자에게 제공되는 매트릭스(또는 템플릿이라고 할 수 있음) 역할을 합니다. - src/main.js
이 JavaScript 파일에는 주로 최상위/프로젝트 수준 종속성을 관리하고 최상위 수준 Vue 구성 요소를 정의하는 코드가 포함되어 있습니다. 즉, 전체 프로젝트에 대한 JavaScript를 조정하고 애플리케이션의 진입점 역할을 합니다. 특정 노드 모듈에 대한 프로젝트 전체 종속성을 선언해야 하거나 프로젝트의 최상위 Vue 구성 요소에 대해 변경하려는 사항이 있는 경우 이 파일을 편집하십시오. - src/App.vue
이전 시점에서 "최상위 Vue 구성 요소"에 대해 이야기할 때 우리는 본질적으로 이 파일에 대해 이야기했습니다. 프로젝트의 각 .vue 파일은 구성 요소이며 구성 요소는 계층적으로 관련되어 있습니다. 처음에는 단 하나의.vue파일, 즉App.vue가 유일한 구성 요소입니다. 그러나 곧 프로젝트에 더 많은 구성 요소를 추가하고(주로 대시보드 구조를 따름) App.vue가 모든 것의 조상이 되는 원하는 계층 구조에 따라 구성 요소를 연결할 것입니다. 이.vue파일에는 Vue가 작성하기를 원하는 형식의 코드가 포함됩니다. 걱정하지 마세요. 그것들은 우리를 제정신이고 조직화할 수 있는 구조를 유지하면서 작성된 JavaScript 코드입니다. 경고를 받았습니다. 이 프로젝트가 끝날 때 Vue가 처음이라면template — script — styletemplate — script — style코드를 구성하는template — script — style방식!
이제 기초를 만들었으므로 다음을 수행할 차례입니다.
- 템플릿을 수정하고 구성 파일을 약간 수정하여 프로젝트가 원하는 대로 작동하도록 합니다.
- 새
.vue파일을 만들고 Vue 코드로 대시보드 구조를 구현합니다.
우리는 다음 섹션에서 그것들을 배울 것입니다. 이 섹션은 약간 길고 주의가 필요합니다. 카페인이나 물이 필요하거나 배출하고 싶다면 지금이 적기입니다!
3. 기본 프로젝트 구조 사용자 정의
비계 프로젝트가 우리에게 준 기초를 땜질할 때입니다. 시작하기 전에 webpack 에서 제공하는 개발 서버가 실행 중인지 확인하십시오. 이 서버를 지속적으로 실행하는 것의 장점은 소스 코드에서 변경한 사항(저장하고 웹 페이지를 새로 고치는 것)이 브라우저에 즉시 반영된다는 것입니다.
개발 서버를 시작하려면 터미널에서 다음 명령을 실행하기만 하면 됩니다(현재 디렉터리가 프로젝트 디렉터리라고 가정).
npm run dev다음 섹션에서는 기존 파일 중 일부를 수정하고 일부 새 파일을 추가합니다. 그 다음에는 해당 파일의 내용에 대한 간략한 설명이 있으므로 이러한 변경이 무엇을 의미하는지 알 수 있습니다.
기존 파일 수정
index.html
우리의 애플리케이션은 말 그대로 단일 페이지 애플리케이션입니다. 브라우저에 표시되는 웹페이지가 단 하나뿐이기 때문입니다. 나중에 이것에 대해 이야기하겠지만 먼저 <title> 태그 내의 텍스트를 변경하는 첫 번째 변경을 수행해 보겠습니다.
이 작은 수정으로 HTML 파일은 다음과 같이 보입니다.
<!DOCTYPE html> <html lang="en"> <head> <meta charset="utf-8"> <!-- Modify the text of the title tag below --> <title>Vue Weather Dashboard</title> </head> <body> <div></div> <script src="/dist/build.js"></script> </body> </html> 잠시 시간을 내어 localhost:8080 에서 웹페이지를 새로고침하고 브라우저 탭의 제목 표시줄에 반영된 변경 사항을 확인하십시오. "Vue Weather Dashboard"라고 표시되어야 합니다. 그러나 이것은 변경을 수행하고 작동하는지 확인하는 프로세스를 보여주기 위한 것입니다. 할 일이 더 있습니다!
이 간단한 HTML 페이지에는 특히 다음과 같이 프로젝트에서 원하는 많은 것들이 부족합니다.
- 일부 메타 정보
- 부트스트랩(CSS 프레임워크)에 대한 CDN 링크
- 사용자 정의 스타일시트에 대한 링크(아직 프로젝트에 추가되지 않음)
-
<script>태그에서 Google Maps Geolocation API에 대한 포인터
이러한 것들을 추가한 후 최종 index.html 에는 다음 내용이 포함됩니다.
<!DOCTYPE html> <html lang="en"> <head> <meta http-equiv="Content-Type" content="text/html;charset=utf-8" /> <meta http-equiv="X-UA-Compatible" content="IE=edge"> <meta name="viewport" content="width=device-width, initial-scale=1, shrink-to-fit=no"> <link rel="stylesheet" href="//maxcdn.bootstrapcdn.com/bootstrap/4.0.0/css/bootstrap.min.css"> <link rel="stylesheet" type="text/css" href="src/css/style.css"> <title>Weather Dashboard</title> <script src="https://maps.googleapis.com/maps/api/js?key=AIzaSyC-lCjpg1xbw-nsCc11Si8Ldg2LKYizqI4&libraries=places"></script> </head> <body> <div></div> <script src="/dist/build.js"></script> </body> </html>파일을 저장하고 웹 페이지를 새로 고칩니다. 페이지가 로드되는 동안 약간의 충돌을 보았을 수 있습니다. 이는 주로 페이지 스타일이 이제 Bootstrap에 의해 제어되고 글꼴, 간격 등과 같은 스타일 요소가 기본값과 다르기 때문입니다. 더 일찍(확실하지 않은 경우 기본값으로 롤백하고 차이점을 확인하십시오).

참고 : 계속 진행하기 전에 한 가지 중요한 사항은 Google Maps API의 URL에 FusionCharts의 속성인 키가 포함되어 있다는 것입니다. 지금은 이 키를 사용하여 프로젝트를 빌드할 수 있습니다. 이러한 유형의 미세한 세부 사항(초기 단계일 때 주의가 산만해질 수 있음)에 얽매이는 것을 원하지 않기 때문입니다. 그러나 약간의 진전이 있고 이러한 작은 세부사항에 주의를 기울이는 데 편안함을 느낀다면 고유한 Google Maps API 키를 생성하고 사용할 것을 강력히 권장합니다.
패키지.json
이 글을 쓰는 시점에서 우리는 프로젝트에 특정 버전의 npm 패키지를 사용했으며 이러한 것들이 함께 작동한다는 것을 알고 있습니다. 그러나 프로젝트를 실행할 때 npm이 다운로드한 최신 안정 버전 패키지가 우리가 사용한 것과 같지 않을 가능성이 매우 높아 코드가 깨질 수 있습니다. 우리의 통제). 따라서 이 프로젝트를 빌드하는 데 사용된 정확히 동일한 package.json 파일을 갖는 것이 매우 중요하므로 코드/설명과 결과가 일관됩니다.
package.json 파일의 내용은 다음과 같아야 합니다.
{ "name": "vue_weather_dashboard", "description": "A Vue.js project", "version": "1.0.0", "author": "FusionCharts", "license": "MIT", "private": true, "scripts": { "dev": "cross-env NODE_ENV=development webpack-dev-server --open --hot", "build": "cross-env NODE_ENV=production webpack --progress --hide-modules" }, "dependencies": { "axios": "^0.18.0", "babel": "^6.23.0", "babel-cli": "^6.26.0", "babel-polyfill": "^6.26.0", "fusioncharts": "^3.13.3", "moment": "^2.22.2", "moment-timezone": "^0.5.21", "vue": "^2.5.11", "vue-fusioncharts": "^2.0.4" }, "browserslist": [ "> 1%", "last 2 versions", "not ie <= 8" ], "devDependencies": { "babel-core": "^6.26.0", "babel-loader": "^7.1.2", "babel-preset-env": "^1.6.0", "babel-preset-stage-3": "^6.24.1", "cross-env": "^5.0.5", "css-loader": "^0.28.7", "file-loader": "^1.1.4", "vue-loader": "^13.0.5", "vue-template-compiler": "^2.4.4", "webpack": "^3.6.0", "webpack-dev-server": "^2.9.1" } } 새로운 package.json 을 살펴보고 json에 있는 다양한 객체의 기능이 무엇인지 파악하는 것이 좋습니다. " author " 키 값을 자신의 이름으로 변경하는 것이 좋습니다. 또한 종속성에 언급된 패키지는 코드에서 적절한 시간에 표시됩니다. 당분간은 다음을 아는 것으로 충분합니다.
-
babel관련 패키지는 브라우저에서 ES6 스타일 코드를 올바르게 처리하기 위한 것입니다. -
axios는 Promise 기반 HTTP 요청을 처리합니다. -
moment및 moment-timezone은 날짜/시간 조작을 위한 것입니다. -
fusioncharts및vue-fusioncharts는 차트 렌더링을 담당합니다. - 명백한 이유로
vue.
웹팩.config.js
package.json 과 마찬가지로 프로젝트 빌드에 사용한 것과 일관된 webpack.config.js 파일을 유지하는 것이 좋습니다. 그러나 변경하기 전에 webpack.config.js 의 기본 코드와 아래에 제공된 코드를 주의 깊게 비교하는 것이 좋습니다. 꽤 많은 차이점을 발견할 수 있을 것입니다. 구글링을 해보면 그것들이 의미하는 바에 대한 기본적인 아이디어가 있습니다. 웹팩 구성에 대해 자세히 설명하는 것은 이 기사의 범위를 벗어나므로 이 점에 대해서는 독자가 책임져야 합니다.
사용자 정의된 webpack.config.js 파일은 다음과 같습니다.
var path = require('path') var webpack = require('webpack') module.exports = { entry: ['babel-polyfill', './src/main.js'], output: { path: path.resolve(__dirname, './dist'), publicPath: '/dist/', filename: 'build.js' }, module: { rules: [ { test: /\.css$/, use: [ 'vue-style-loader', 'css-loader' ], }, { test: /\.vue$/, loader: 'vue-loader', options: { loaders: { } // other vue-loader options go here } }, { test: /\.js$/, loader: 'babel-loader', exclude: /node_modules/ }, { test: /\.(png|jpg|gif|svg)$/, loader: 'file-loader', options: { name: '[name].[ext]?[hash]' } } ] }, resolve: { alias: { 'vue$': 'vue/dist/vue.esm.js' }, extensions: ['*', '.js', '.vue', '.json'] }, devServer: { historyApiFallback: true, noInfo: true, overlay: true, host: '0.0.0.0', port: 8080 }, performance: { hints: false }, devtool: '#eval-source-map' } if (process.env.NODE_ENV === 'production') { module.exports.devtool = '#source-map' // https://vue-loader.vuejs.org/en/workflow/production.html module.exports.plugins = (module.exports.plugins || []).concat([ new webpack.DefinePlugin({ 'process.env': { NODE_ENV: '"production"' } }), new webpack.optimize.UglifyJsPlugin({ sourceMap: true, compress: { warnings: false } }), new webpack.LoaderOptionsPlugin({ minimize: true }) ]) } 프로젝트의 webpack.config.js 가 변경되면 실행 중인 개발 서버를 중지( Ctrl + C )하고 패키지에 언급된 모든 package.json 를 설치한 후 프로젝트 디렉토리에서 다음 명령을 실행하여 다시 시작해야 합니다. package.json 파일:
npm install npm run dev이것으로 구성을 조정하고 올바른 패키지가 제자리에 있는지 확인하는 시련이 끝납니다. 그러나 이것은 또한 코드를 수정하고 작성하는 여정을 표시합니다. 이는 약간 길지만 매우 보람이 있습니다!
src/main.js
이 파일은 프로젝트의 최상위 오케스트레이션의 핵심입니다. 여기에서 다음을 정의합니다.
- 최상위 종속성(필요한 가장 중요한 npm 패키지를 얻을 수 있는 위치)
- 플러그인/래퍼가 있는 경우 Vue에 대한 지침과 함께 종속성을 해결하는 방법
- 프로젝트의 최상위 구성 요소를 관리하는 Vue 인스턴스:
src/App.vue(노달.vue파일).
src/main.js 파일에 대한 우리의 목표에 따라 코드는 다음과 같아야 합니다.
// Import the dependencies and necessary modules import Vue from 'vue'; import App from './App.vue'; import FusionCharts from 'fusioncharts'; import Charts from 'fusioncharts/fusioncharts.charts'; import Widgets from 'fusioncharts/fusioncharts.widgets'; import PowerCharts from 'fusioncharts/fusioncharts.powercharts'; import FusionTheme from 'fusioncharts/themes/fusioncharts.theme.fusion'; import VueFusionCharts from 'vue-fusioncharts'; // Resolve the dependencies Charts(FusionCharts); PowerCharts(FusionCharts); Widgets(FusionCharts); FusionTheme(FusionCharts); // Globally register the components for project-wide use Vue.use(VueFusionCharts, FusionCharts); // Instantiate the Vue instance that controls the application new Vue({ el: '#app', render: h => h(App) })src/App.vue
이것은 전체 프로젝트에서 가장 중요한 파일 중 하나이며 계층 구조의 최상위 구성 요소, 즉 전체 응용 프로그램 자체를 나타냅니다. 우리 프로젝트의 경우 이 구성 요소가 모든 무거운 작업을 수행하며 나중에 살펴보겠습니다. 지금은 기본 상용구를 없애고 우리 고유의 것을 추가하려고 합니다.
Vue의 코드 구성 방법이 처음이라면 .vue 파일 내의 일반적인 구조에 대한 아이디어를 얻는 것이 좋습니다. .vue 파일은 세 섹션으로 구성됩니다.
- 주형
여기에서 페이지의 HTML 템플릿이 정의됩니다. 정적 HTML 외에도 이 섹션에는 이중 중괄호{{ }}를 사용하여 동적 콘텐츠를 포함하는 Vue의 방법도 포함되어 있습니다. - 스크립트
JavaScript는 이 섹션을 관리하며 HTML 템플릿 내 적절한 위치에 있는 동적 콘텐츠를 생성하는 역할을 합니다. 이 섹션은 주로 내보내는 개체이며 다음으로 구성됩니다.- 데이터
이것은 함수 자체이며 일반적으로 멋진 데이터 구조 내에 캡슐화된 원하는 데이터를 반환합니다. - 행동 양식
하나 이상의 함수/메서드로 구성된 객체로, 각각은 일반적으로 어떤 식으로든 데이터를 조작하고 HTML 템플릿의 동적 콘텐츠도 제어합니다. - 계산됨
한 가지 중요한 차이점을 가지고 위에서 논의한 메소드 객체와 매우 유사합니다. 메소드 객체 내의 모든 함수는 그 중 하나가 호출될 때마다 실행되는 반면, 계산된 객체 내의 함수는 훨씬 더 현명하게 동작하고 다음과 같은 경우에만 실행됩니다. 라고 불리는.
- 데이터
- 스타일
이 섹션은 페이지의 HTML에 적용되는 CSS 스타일을 위한 것입니다(템플릿 내에 작성됨) — 페이지를 아름답게 만들기 위해 여기에 좋은 오래된 CSS를 넣으십시오!
위의 패러다임을 염두에 두고 App.vue 에서 코드를 최소한으로 사용자 지정해 보겠습니다.
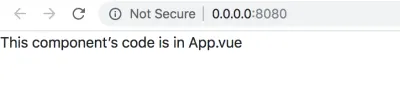
<template> <div> <p>This component's code is in {{ filename }}</p> </div> </template> <script> export default { data() { return { filename: 'App.vue' } }, methods: { }, computed: { }, } </script> <style> </style> 위의 코드 스니펫은 단순히 App.vue 가 내부 코드로 작동하는지 테스트하기 위한 것임을 기억하십시오. 나중에 많은 변경을 거치게 되지만 먼저 파일을 저장하고 브라우저에서 페이지를 새로 고칩니다.
이 시점에서 도구에 대한 도움을 받는 것이 좋습니다. Chrome용 Vue devtools를 확인하고 Google Chrome을 개발용 기본 브라우저로 사용하는 데 큰 문제가 없다면 도구를 설치하고 조금 가지고 놀아보세요. 상황이 더 복잡해지면 추가 개발 및 디버깅에 매우 유용할 것입니다.
추가 디렉토리 및 파일
다음 단계는 추가 파일을 추가하여 프로젝트 구조가 완성되도록 하는 것입니다. 다음 디렉토리와 파일을 추가합니다.
-
src/css/—style.css -
src/assets/—calendar.svg—vlocation.svg—search.svg—winddirection.svg—windspeed.svg -
src/components/—Content.vue—Highlights.vue—TempVarChart.vue—UVIndex.vue—Visibility.vue—WindStatus.vue
참고 : 하이퍼링크로 연결된 .svg 파일을 프로젝트에 저장합니다.
위에서 언급한 디렉터리와 파일을 만듭니다. 최종 프로젝트 구조는 다음과 같아야 합니다(이제 필요하지 않은 기본 구조에서 폴더와 파일을 삭제하는 것을 기억하십시오).
vue_weather_dashboard/ |--- README.md |--- node_modules/ | |--- ... | |--- ... | |--- [many npm packages we installed] | |--- ... | |--- ... |--- package.json |--- package-lock.json |--- webpack.config.js |--- index.html |--- src/ | |--- App.vue | |--- css/ | | |--- style.css | |--- assets/ | | |--- calendar.svg | | |--- location.svg | | |--- location.svg | | |--- winddirection.svg | | |--- windspeed.svg | |--- main.js | |--- components/ | | |--- Content.vue | | |--- Highlights.vue | | |--- TempVarChart.vue | | |--- UVIndex.vue | | |--- Visibility.vue | | |--- WindStatus.vue 프로젝트의 루트 폴더에 .babelrc , .gitignore , .editorconfig 등과 같은 다른 파일이 있을 수 있습니다 . 지금은 안전하게 무시해도 됩니다.
다음 섹션에서는 새로 추가된 파일에 최소한의 콘텐츠를 추가하고 제대로 작동하는지 테스트합니다.
src/css/style.css
당장은 별로 쓸모가 없겠지만, 다음 코드를 파일에 복사하세요:
@import url("https://fonts.googleapis.com/css?family=Roboto:300,400,500"); :root { font-size: 62.5%; } body { font-family: Roboto; font-weight: 400; width: 100%; margin: 0; font-size: 1.6rem; } #sidebar { position: relative; display: flex; flex-direction: column; background-image: linear-gradient(-180deg, #80b6db 0%, #7da7e2 100%); } #search { text-align: center; height: 20vh; position: relative; } #location-input { height: 42px; width: 100%; opacity: 1; border: 0; border-radius: 2px; background-color: rgba(255, 255, 255, 0.2); margin-top: 16px; padding-left: 16px; color: #ffffff; font-size: 1.8rem; line-height: 21px; } #location-input:focus { outline: none; } ::placeholder { color: #FFFFFF; opacity: 0.6; } #current-weather { color: #ffffff; font-size: 8rem; line-height: 106px; position: relative; } #current-weather>span { color: #ffffff; font-size: 3.6rem; line-height: 42px; vertical-align: super; opacity: 0.8; top: 15px; position: absolute; } #weather-desc { font-size: 2.0rem; color: #ffffff; font-weight: 500; line-height: 24px; } #possibility { color: #ffffff; font-size: 16px; font-weight: 500; line-height: 19px; } #max-detail, #min-detail { color: #ffffff; font-size: 2.0rem; font-weight: 500; line-height: 24px; } #max-detail>i, #min-detail>i { font-style: normal; height: 13.27px; width: 16.5px; opacity: 0.4; } #max-detail>span, #min-detail>span { color: #ffffff; font-family: Roboto; font-size: 1.2rem; line-height: 10px; vertical-align: super; } #max-summary, #min-summary { opacity: 0.9; color: #ffffff; font-size: 1.4rem; line-height: 16px; margin-top: 2px; opacity: 0.7; } #search-btn { position: absolute; right: 0; top: 16px; padding: 2px; z-index: 999; height: 42px; width: 45px; background-color: rgba(255, 255, 255, 0.2); border: none; } #dashboard-content { text-align: center; height: 100vh; } #date-desc, #location-desc { color: #ffffff; font-size: 1.6rem; font-weight: 500; line-height: 19px; margin-bottom: 15px; } #date-desc>img { top: -3px; position: relative; margin-right: 10px; } #location-desc>img { top: -3px; position: relative; margin-left: 5px; margin-right: 15px; } #location-detail { opacity: 0.7; color: #ffffff; font-size: 1.4rem; line-height: 20px; margin-left: 35px; } .centered { position: fixed; top: 45%; left: 50%; transform: translate(-50%, -50%); } .max-desc { width: 80px; float: left; margin-right: 28px; } .temp-max-min { margin-top: 40px } #dashboard-content { background-color: #F7F7F7; } .custom-card { background-color: #FFFFFF !important; border: 0 !important; margin-top: 16px !important; margin-bottom: 20px !important; } .custom-content-card { background-color: #FFFFFF !important; border: 0 !important; margin-top: 16px !important; margin-bottom: 0px !important; } .header-card { height: 50vh; } .content-card { height: 43vh; } .card-divider { margin-top: 0; } .content-header { color: #8786A4; font-size: 1.4rem; line-height: 16px; font-weight: 500; padding: 15px 10px 5px 15px; } .highlights-item { min-height: 37vh; max-height: 38vh; background-color: #FFFFFF; } .card-heading { color: rgb(33, 34, 68); font-size: 1.8rem; font-weight: 500; line-height: 21px; text-align: center; } .card-sub-heading { color: #73748C; font-size: 1.6rem; line-height: 19px; } .card-value { color: #000000; font-size: 1.8rem; line-height: 21px; } span text { font-weight: 500 !important; } hr { padding-top: 1.5px; padding-bottom: 1px; margin-bottom: 0; margin-top: 0; line-height: 0.5px; } @media only screen and (min-width: 768px) { #sidebar { height: 100vh; } #info { position: fixed; bottom: 50px; width: 100%; padding-left: 15px; } .wrapper-right { margin-top: 80px; } } @media only screen and (min-width:1440px) { #sidebar { width: 350px; max-width: 350px; flex: auto; } #dashboard-content { width: calc(100% — 350px); max-width: calc(100% — 350px); flex: auto; } }src/자산/
이 디렉토리에서 아래에 언급된 .svg 파일을 다운로드하여 저장합니다.
-
calendar.svg -
location.svg -
search.svg -
winddirection.svg -
windspeed.svg
src/components/Content.vue
이것은 계층을 유지하기 위해 존재하는 "멍청한 구성 요소"(즉, 자리 표시자)라고 하며 본질적으로 데이터를 하위 구성 요소에 전달합니다.
App.vue 파일에 모든 코드를 작성하는 데 기술적인 제한은 없지만 두 가지 이유로 구성 요소를 중첩하여 코드를 분할하는 방식을 취합니다.
- 가독성과 유지 보수성을 돕는 깨끗한 코드를 작성합니다.
- 화면에서 볼 수 있는 동일한 구조, 즉 계층 구조를 복제합니다.
루트 구성 요소 App.vue 내에서 Content.vue 에 정의된 구성 요소를 중첩하기 전에 Content.vue 에 대한 장난감(하지만 교육적인) 코드를 작성해 보겠습니다.
<template> <div> <p>This child components of Content.vue are:</p> <ul> <li v-for="child in childComponents">{{ child }}</li> </ul> </div> </template> <script> export default { data () { return { childComponents: ['TempVarChart.vue', 'Highlights.vue'] } }, methods: { }, computed: { }, } </script> <style> </style>코드에서 다음을 주의 깊게 관찰하고 이해합니다.
-
<script>태그(우리가 분명히 일부 JavaScript 코드를 작성하는 위치) 내에서 기본적으로 내보내는(다른 파일에서 사용할 수 있는) 객체를 정의합니다. 이 객체에는 더 중첩되어야 하는 구성 요소 파일의 이름인 요소와 함께childComponents라는 배열 객체를 반환하는 함수data()가 포함되어 있습니다. -
<template>태그(HTML 템플릿을 작성하는 위치) 내에서 관심 있는 것은<ul>입니다.- 정렬되지 않은 목록 내에서 각 목록 항목은 배열 객체
childComponents에 정의된 대로 의도한 자식 구성 요소의 이름이어야 합니다. 또한 목록은 배열의 마지막 요소까지 자동으로 확장되어야 합니다.for루프를 작성해야 하는 것 같군요, 그렇죠? Vue.js에서 제공하는v-for지시문을 사용하여 이를 수행합니다.v-for지시문:-
<li>태그의 속성으로 작동하고, 배열을 반복하고,{{ }}대괄호(목록 항목에 대한 텍스트를 작성하는 곳) 내에서 반복자가 언급되는 자식 구성 요소의 이름을 렌더링합니다.
-
- 정렬되지 않은 목록 내에서 각 목록 항목은 배열 객체
위의 코드와 설명은 스크립트와 템플릿이 상호 연관되는 방식과 Vue.js에서 제공하는 지시문을 사용하는 방법에 대한 후속 이해의 기초를 형성합니다.
우리는 많은 것을 배웠지만 이 모든 후에도 계층 구조에서 구성 요소를 매끄럽게 연결하는 방법에 대해 배워야 할 것이 하나 남아 있습니다. 즉, 상위 구성 요소에서 하위 구성 요소로 데이터를 전달하는 것입니다. 지금은 src/App.vue 에서 src/components/Content.vue 로 일부 데이터를 전달하는 방법을 배워야 이 프로젝트의 나머지 구성 요소 중첩에 동일한 기술을 사용할 수 있습니다.
상위 구성 요소에서 하위 구성 요소로 떨어지는 데이터는 단순하게 들릴 수 있지만 악마는 세부 사항에 있습니다! 아래에 간략하게 설명된 것처럼 작동하려면 여러 단계가 필요합니다.
- 정의 및 데이터
지금은 정적 데이터를 가지고 놀기를 원합니다. 날씨의 다양한 측면에 대한 하드 코딩된 값을 포함하는 객체는 괜찮습니다!weather_data라는 객체를 만들고App.vue의data()함수에서 반환합니다.weather_data객체는 아래 스니펫에 제공됩니다.
weather_data: { location: "California", temperature: { current: "35 C", }, highlights: { uvindex: "3", windstatus: { speed: "20 km/h", direction: "NE", }, visibility: "12 km", }, },- 부모로부터 데이터 전달
데이터를 전달하려면 데이터를 보낼 목적지가 필요합니다! 이 경우 대상은Content.vue구성 요소이며 구현 방법은 다음과 같습니다.-
<Content>태그의 사용자 정의 속성 에weather_data개체 할당 - Vue.js에서 제공하는
v-bind: 지시문을 사용하여 속성을 데이터와 바인딩합니다. 그러면 속성 값을 동적으로 만듭니다(원래 데이터의 변경 사항에 응답).<Content v-bind:weather_data=“weather_data”></Content>
-
데이터 정의 및 전달은 핸드셰이크의 소스 측에서 처리되며 이 경우 App.vue 파일입니다.
현재 상태의 App.vue 파일에 대한 코드는 다음과 같습니다.
<template> <div> <p>This component's code is in {{ filename }}</p> <Content v-bind:weather_data="weather_data"></Content> </div> </template> <script> import Content from './components/Content.vue' export default { name: 'app', components: { 'Content': Content }, data () { return { filename: 'App.vue', weather_data: { location: "California", temperature: { current: "35 C", }, highlights: { uvindex: "3", windstatus: { speed: "20 km/h", direction: "NE", }, visibility: "12 km", }, }, } }, methods: { }, computed: { }, } </script> <style> </style> 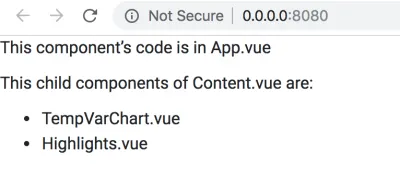
데이터가 정의되고 소스(상위 구성 요소)에서 전달되면 이제 다음 두 단계에서 설명하는 대로 데이터를 수신하고 적절하게 렌더링하는 것은 자녀의 책임입니다.
- 아이가 데이터 수신
자식 구성 요소(이 경우Content.vue)는 부모 구성 요소App.vue에서 보낸weather_data개체를 받아야 합니다. Vue.js는 그렇게 하는 메커니즘을 제공합니다. 필요한 것은Content.vue에서 내보낸 기본 객체에 정의된props라는 배열 객체 뿐입니다. 배열props의 각 요소는 부모로부터 받고자 하는 데이터 객체의 이름입니다. 현재로서는 App.vue의weather_data가 수신해야 하는 유일한 데이터 개체입니다. 따라서props배열은 다음과 같습니다.
<template> // HTML template code here </template> <script> export default { props: ["weather_data"], data () { return { // data here } }, } </script> <style> // component specific CSS here </style>- 페이지의 데이터 렌더링
이제 데이터 수신을 확인했으므로 완료해야 하는 마지막 작업은 데이터를 렌더링하는 것입니다. 이 예에서는 기술을 설명하기 위해 수신된 데이터를 웹 페이지에 직접 덤프합니다. 그러나 실제 응용 프로그램(예: 우리가 구축하려는 응용 프로그램)에서 데이터는 일반적으로 많은 처리를 거치며 관련 부분만 목적에 맞는 방식으로 표시됩니다. 예를 들어 이 프로젝트에서는 결국 날씨 API에서 원시 데이터를 가져와 정리 및 형식화하고 차트에 필요한 데이터 구조에 데이터를 공급한 다음 시각화합니다. 어쨌든 원시 데이터 덤프를 표시하기 위해 아래 스니펫과 같이 Vue가 이해하는{{ }}대괄호를 사용합니다.
<template> <div> // other template code here {{ weather_data }} </div> </template> 이제 모든 조각과 조각을 동화할 때입니다. 현재 상태의 Content.vue 코드는 다음과 같습니다.
<template> <div> <p>This child components of Content.vue are:</p> <ul> <li v-for="child in childComponents">{{ child }}</li> </ul> {{ weather_data }} </div> </template> <script> export default { props: ["weather_data"], data () { return { childComponents: ['TempVarChart.vue', 'Highlights.vue'] } }, methods: { }, computed: { }, } </script> <style> #pagecontent { border: 1px solid black; padding: 2px; } </style> 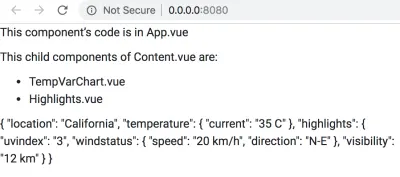
위에서 설명한 대로 변경한 후 브라우저에서 웹 페이지를 새로 고치고 어떻게 보이는지 확인하십시오. 잠시 시간을 내어 Vue가 처리하는 복잡성에 대해 알아보세요. App.vue 에서 weather_data 개체를 수정하면 자동으로 Content.vue 에 전달되고 결국에는 웹페이지를 표시하는 브라우저에 전달됩니다! 키 위치의 값을 변경하여 시도하십시오.
정적 데이터를 사용하여 props와 데이터 바인딩에 대해 배웠지만 응용 프로그램에서 웹 API를 사용하여 수집한 동적 데이터를 사용하고 그에 따라 코드를 변경합니다 .
요약
나머지 .vue 파일로 이동하기 전에 App.vue 및 components/Content.vue 에 대한 코드를 작성하는 동안 배운 내용을 요약해 보겠습니다.
-
App.vue파일은 우리가 루트 구성 요소라고 부르는 것입니다. 구성 요소 계층 구조의 맨 위에 있는 파일입니다. 나머지.vue파일은 직계 자식, 손자 등인 구성 요소를 나타냅니다. -
Content.vue파일은 더미 구성 요소입니다. 그 책임은 데이터를 아래 수준으로 전달하고 구조적 계층 구조를 유지하여 코드가 "*우리가 보는 것이 구현하는 것*"이라는 철학과 일관성을 유지하도록 하는 것입니다. - 구성 요소의 부모-자식 관계는 갑자기 발생하지 않습니다. 구성 요소를 등록해야 합니다(구성 요소 의 의도된 용도에 따라 전역 또는 로컬로). 그런 다음 맞춤 HTML 태그(철자가 정확한 구성 요소가 등록된 이름과 동일).
- 일단 등록되고 중첩되면 데이터는 상위 구성 요소에서 하위 구성 요소로 전달되며 흐름은 절대 역전되지 않습니다 (프로젝트 아키텍처에서 역류를 허용하면 나쁜 일이 발생함). 상위 구성 요소는 데이터의 상대 소스이며 사용자 정의 HTML 요소의 속성에 대한
v-bind지시문을 사용하여 관련 데이터를 하위 요소에 전달합니다. 아이는 props를 사용하여 의도된 데이터를 받은 다음 데이터로 무엇을 할 것인지 스스로 결정합니다.
나머지 구성 요소에 대해서는 자세한 설명을 하지 않겠습니다. 위의 요약에서 배운 내용을 기반으로 코드를 작성하기만 하면 됩니다. 코드는 자명하며 계층 구조에 대해 혼란스럽다면 아래 다이어그램을 참조하십시오.
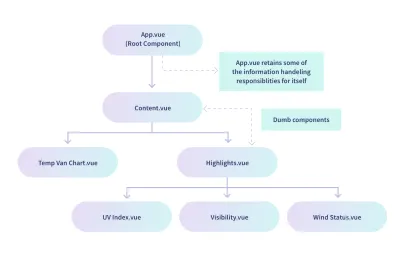
다이어그램은 TempVarChart.vue 및 Highlights.vue 가 Content.vue 의 직계 자식임을 나타냅니다. 따라서 아래 코드를 사용하여 해당 구성 요소에 데이터를 보내기 위해 Content.vue 를 준비하는 것이 좋습니다.
<template> <div> <p>This child components of Content.vue are:</p> <ul> <li v-for="child in childComponents">{{ child }}</li> </ul> {{ weather_data }} <temp-var-chart :tempVar="tempVar"></temp-var-chart> <today-highlights :highlights="highlights"></today-highlights> </div> </template> <script> import TempVarChart from './TempVarChart.vue' import Highlights from './Highlights.vue' export default { props: ["weather_data"], components: { 'temp-var-chart': TempVarChart, 'today-highlights': Highlights }, data () { return { childComponents: ['TempVarChart.vue', 'Highlights.vue'], tempVar: this.weather_data.temperature, highlights: this.weather_data.highlights, } }, methods: { }, computed: { }, } </script> <style> </style> 이 코드를 저장하면 오류가 발생합니다. 예상되는 것이므로 걱정하지 마십시오. 나머지 구성 요소 파일이 준비되면 수정됩니다. 출력을 볼 수 없는 것이 귀찮다면 사용자 정의 요소 태그 <temp-var-chart> 및 <today-highlights> 가 포함된 행을 주석 처리하십시오.
이 섹션의 경우 이것은 Content.vue 의 최종 코드입니다. 이 섹션의 나머지 부분에서는 학습을 위해 작성한 이전 코드가 아니라 이 코드를 참조합니다 .
src/components/TempVarChart.vue
데이터를 전달하는 상위 구성 요소 Content.vue 와 함께 TempVarChart.vue 는 아래 코드와 같이 데이터를 수신하고 렌더링하도록 설정해야 합니다.
<template> <div> <p>Temperature Information:</p> {{ tempVar }} </div> </template> <script> export default { props: ["tempVar"], data () { return { } }, methods: { }, computed: { }, } </script> <style> </style>src/components/Highlights.vue
이 구성 요소는 상위 구성 요소인 App.vue 에서도 데이터를 수신합니다. 그런 다음 자식 구성 요소와 연결되어야 하며 관련 데이터가 자식 구성 요소에 전달되어야 합니다.
먼저 부모로부터 데이터를 수신하는 코드를 살펴보겠습니다.
<template> <div> <p>Weather Highlights:</p> {{ highlights }} </div> </template> <script> export default { props: ["highlights"], data () { return { } }, methods: { }, computed: { }, } </script> <style> </style>이 시점에서 웹 페이지는 아래 이미지와 같습니다.
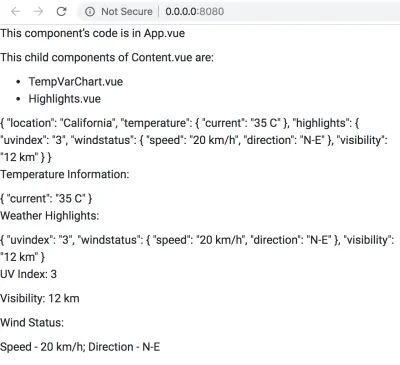
이제 Highlights.vue 의 코드를 수정하여 자식 구성 요소를 등록하고 중첩한 다음 데이터를 자식에게 전달해야 합니다. 이에 대한 코드는 다음과 같습니다.
<template> <div> <p>Weather Highlights:</p> {{ highlights }} <uv-index :highlights="highlights"></uv-index> <visibility :highlights="highlights"></visibility> <wind-status :highlights="highlights"></wind-status> </div> </template> <script> import UVIndex from './UVIndex.vue'; import Visibility from './Visibility.vue'; import WindStatus from './WindStatus.vue'; export default { props: ["highlights"], components: { 'uv-index': UVIndex, 'visibility': Visibility, 'wind-status': WindStatus, }, data () { return { } }, methods: { }, computed: { }, } </script> <style> </style> 코드를 저장하고 웹 페이지 를 보면 브라우저에서 제공하는 개발자 콘솔 도구에 오류가 표시 됩니다. Highlights.vue 가 데이터를 전송하지만 아무도 데이터를 수신하지 않기 때문에 나타납니다. 아직 Highlights.vue 의 자식 코드를 작성하지 않았습니다.
데이터 처리를 많이 하지 않았음을 관찰하십시오. 즉, 대시보드의 하이라이트 섹션 아래에 있는 날씨 데이터의 개별 요소를 추출하지 않았습니다. 우리는 data() 함수에서 그것을 할 수 있었지만 우리는 Highlights.vue 가 받는 전체 데이터 덤프를 각 자식에게 전달하는 멍청한 구성 요소를 유지하는 것을 선호했습니다. . 그러나 Highlights.vue 에서 데이터를 추출하고 관련 데이터를 각 하위 구성 요소로 보내는 것이 좋습니다. 그럼에도 불구하고 좋은 연습입니다!
src/components/UVIndex.vue
이 구성 요소의 코드는 Highlights.vue 데이터 덤프를 수신하고 UV 인덱스에 대한 데이터를 추출하여 페이지에 렌더링합니다.
<template> <div> <p>UV Index: {{ uvindex }}</p> </div> </template> <script> export default { props: ["highlights"], data () { return { uvindex: this.highlights.uvindex } }, methods: { }, computed: { }, } </script> <style> </style>src/components/Visibility.vue
이 구성 요소의 코드는 Highlights.vue 의 데이터 덤프를 수신하고 가시성을 위한 데이터를 추출하고 페이지에 렌더링합니다.
<template> <div> <p>Visibility: {{ visibility }}</p> </div> </template> <script> export default { props: ["highlights"], data () { return { visibility: this.highlights.visibility, } }, methods: { }, computed: { }, } </script> <style> </style>src/components/WindStatus.vue
이 구성 요소의 코드는 Highlights.vue 의 데이터 덤프를 수신하고 바람 상태(속도 및 방향)에 대한 데이터를 추출하고 페이지에 렌더링합니다.
<template> <div> <p>Wind Status:</p> <p>Speed — {{ speed }}; Direction — {{ direction }}</p> </div> </template> <script> export default { props: ["highlights"], data () { return { speed: this.highlights.windstatus.speed, direction: this.highlights.windstatus.direction } }, methods: { }, computed: { }, } </script> <style> </style>모든 구성 요소에 대한 코드를 추가한 후 브라우저에서 웹 페이지를 살펴봅니다.
실망시키려는 것은 아니지만 이 모든 수고는 구성 요소를 계층 구조로 연결하고 구성 요소 간에 데이터 흐름이 발생하는지 여부를 테스트하는 것이었습니다! 다음 섹션에서는 지금까지 작성한 대부분의 코드를 버리고 실제 프로젝트와 관련된 더 많은 코드를 추가합니다. 그러나 우리는 확실히 구성 요소의 구조와 중첩을 유지할 것입니다. 이 섹션에서 배운 내용을 통해 Vue.js로 적절한 대시보드를 구축할 수 있습니다.
4. 데이터 수집 및 처리
App.vue 의 weather_data 객체를 기억하십니까? 모든 구성 요소가 올바르게 작동하는지 테스트하고 실제 데이터의 세부 사항에 얽매이지 않고 Vue 응용 프로그램의 몇 가지 기본 측면을 배우는 데 도움이 되는 일부 하드 코딩된 데이터가 있습니다. 그러나 이제 우리는 껍질을 벗고 API의 데이터가 대부분의 코드를 지배하는 현실 세계로 나갈 때입니다.
실제 데이터를 수신하고 처리하기 위한 하위 구성요소 준비
이 섹션에서는 App.vue 를 제외한 모든 구성 요소에 대한 코드 덤프를 가져옵니다. 이 코드는 App.vue 에서 실제 데이터 수신을 처리합니다(이전 섹션에서 더미 데이터를 수신하고 렌더링하기 위해 작성한 코드와 달리).
각 구성 요소의 코드를 주의 깊게 읽어 각 구성 요소가 예상하고 궁극적으로 시각화에 사용할 데이터에 대한 아이디어를 형성할 것을 강력히 권장합니다.
일부 코드와 전체 구조는 이전 구조에서 본 것과 유사하므로 크게 다른 문제는 발생하지 않습니다. 그러나 악마는 디테일에 있다! 따라서 코드를 주의 깊게 살펴보고 충분히 이해했다면 프로젝트의 해당 구성 요소 파일에 코드를 복사하십시오.
참고 : 이 섹션의 모든 구성 요소는 src/components/ 디렉토리에 있습니다. 따라서 매번 경로는 언급되지 않으며 구성 요소를 식별하기 위해 .vue 파일 이름만 언급됩니다.
Content.vue
<template> <div> <temp-var-chart :tempVar="tempVar"></temp-var-chart> <today-highlights :highlights="highlights"></today-highlights> </div> </template> <script> import TempVarChart from './TempVarChart.vue'; import Highlights from './Highlights.vue'; export default { props: ['highlights', 'tempVar'], components: { 'temp-var-chart': TempVarChart, 'today-highlights': Highlights }, } </script>이전 코드에서 다음과 같이 변경되었습니다.
-
<template>에서{{ }}안의 텍스트와 데이터는 제거되었습니다. 이제 우리는 데이터를 수신하고 이 구성 요소에 특정한 렌더링 없이 자식에게 전달하기 때문입니다. -
export default {}에서:-
props는 부모가 보낼 데이터 개체와 일치하도록 변경되었습니다.App.vue. props를 변경하는 이유는App.vue자체가 사용자의 검색어를 기반으로 날씨 API 및 기타 온라인 리소스에서 획득한 일부 데이터를 표시하고 나머지 데이터를 전달하기 때문입니다. 앞서 작성한 더미 코드에서App.vue는 전체 더미 데이터 덤프를 차별 없이 전달하고 있었고 그에 따라Content.vue의 props가 설정되었습니다. - 이 구성 요소에서 데이터 조작을 수행하지 않기 때문에 data() 함수는 이제 아무 것도 반환하지 않습니다.
-
TempVarChart.vue
이 구성 요소는 오늘의 나머지 시간에 대한 자세한 온도 예측을 수신하고 결국 FusionCharts를 사용하여 표시해야 합니다. 그러나 당분간은 웹페이지에 텍스트로만 표시할 예정입니다.
<template> <div> {{ tempVar.tempToday }} </div> </template> <script> export default { props: ["tempVar"], components: {}, data() { return { }; }, methods: { }, }; </script> <style> </style>하이라이트.vue
<template> <div> <uv-index :highlights="highlights"></uv-index> <visibility :highlights="highlights"></visibility> <wind-status :highlights="highlights"></wind-status> </div> </template> <script> import UVIndex from './UVIndex.vue'; import Visibility from './Visibility.vue'; import WindStatus from './WindStatus.vue'; export default { props: ["highlights"], components: { 'uv-index': UVIndex, 'visibility': Visibility, 'wind-status': WindStatus, }, data () { return { } }, methods: { }, computed: { }, } </script> <style> </style>이전 코드에서 변경된 사항은 다음과 같습니다.
-
<template>에서{{ }}내의 텍스트와 데이터는 제거되었습니다. 이는Content.vue와 마찬가지로 구조적 계층 구조를 유지하면서 데이터를 자식에게 전달하는 것뿐인 단순한 구성 요소이기 때문입니다.Highlights.vue및Content.vue와 같은 멍청한 구성 요소는 대시보드의 시각적 구조와 우리가 작성하는 코드 간의 패리티를 유지하기 위해 존재한다는 것을 기억하십시오.
UVIndex.vue
이전 코드의 변경 사항은 다음과 같습니다.
-
<template>및<style>에서div id가uvIndex로 변경되어 더 읽기 쉽습니다. -
export default {}에서data()함수는 이제props를 사용하여 구성 요소가 수신한 하이라이트 객체에서 값을 추출한 문자열 객체uvIndex를 반환합니다. 이uvIndex는 이제 값을<template>내의 텍스트로 표시하는 데 일시적으로 사용됩니다. 나중에 이 값을 차트를 렌더링하는 데 적합한 데이터 구조에 연결할 것입니다.
가시성.vue
<template> <div> <p>Visibility: {{ visibility }}</p> </div> </template> <script> export default { props: ["highlights"], data () { return { visibility: this.highlights.visibility.toString() } }, methods: { }, computed: { }, } </script> <style> </style> 이전 코드와 관련하여 이 파일에서 변경된 사항은 이제 data() 함수에서 반환된 visibility 객체의 정의 끝에 toString() 이 포함된다는 것입니다. 문자열로 변환해야 하는 포인트 번호.
WindStatus.vue
<template> <div> <p>Wind Speed — {{ windSpeed }}</p> <p>Wind Direction — {{ derivedWindDirection }}, or {{ windDirection }} degree clockwise with respect to true N as 0 degree.</p> </div> </template> <script> export default { props: ["highlights"], data () { return { windSpeed: this.highlights.windStatus.windSpeed, derivedWindDirection: this.highlights.windStatus.derivedWindDirection, windDirection: this.highlights.windStatus.windDirection } }, methods: { }, computed: { }, } </script> <style> </style>이전 코드의 변경 사항은 다음과 같습니다.
- 파일 전체에서
windstatus는 가독성을App.vue가 실제 데이터와 함께 제공하는 하이라이트 개체와 동기화하기 위해windStatus로 이름이 변경되었습니다. - 속도와 방향에 대해 유사한 이름 변경이 이루어졌습니다. 새로운 것은
windSpeed및windDirection입니다. - 새로운 개체 파생된
App.vuederivedWindDirection제공됨).
지금은 수신된 데이터가 텍스트로 렌더링됩니다. 나중에 시각화에 필요한 데이터 구조에 연결됩니다.
더미 데이터로 테스트하기
더미 데이터에 반복적으로 의존하는 것은 약간 실망스러울 수 있지만 그 뒤에는 몇 가지 좋은 이유가 있습니다.
- 각 구성 요소의 코드를 많이 변경했으며 이러한 변경으로 인해 코드가 손상되는지 테스트하는 것이 좋습니다. 즉, 이제 프로젝트의 더 복잡한 부분으로 이동하려고 하므로 데이터 흐름이 손상되지 않았는지 확인해야 합니다.
- 온라인 날씨 API의 실제 데이터는 많은 마사지를 필요로 하며 데이터 수집 및 처리를 위한 코드와 구성 요소를 따라 흐르는 원활한 데이터 흐름을 위한 코드 사이에서 저글링을 하는 것이 압도적일 수 있습니다. 아이디어는 복잡성의 양을 제어하여 우리가 직면할 수 있는 오류를 더 잘 이해할 수 있도록 하는 것입니다.
이 섹션에서 우리가 하는 일은 본질적으로 App.vue 에서 일부 json 데이터를 하드코딩하는 것입니다. 이는 가까운 장래에 라이브 데이터로 분명히 대체될 것입니다. 더미 json 구조와 실제 데이터에 사용할 json 구조 사이에는 많은 유사점이 있습니다. 따라서 실제 데이터를 접했을 때 실제 데이터에서 무엇을 기대할 수 있는지에 대한 대략적인 아이디어도 제공합니다.
그러나 이것이 그러한 프로젝트를 처음부터 구축할 때 채택할 수 있는 이상적인 접근 방식과는 거리가 멀다는 것을 인정합니다. 현실 세계에서는 종종 실제 데이터 소스로 시작하여 그것을 길들이기 위해 무엇을 할 수 있고 무엇을 해야 하는지 이해하기 위해 약간의 플레이를 한 다음 관련 정보를 캡처하기 위해 적절한 json 데이터 구조에 대해 생각합니다. Vue.js 및 FusionCharts를 사용하여 대시보드를 구축하는 방법을 배우는 목표에서 더 멀어지기 때문에 모든 더러운 작업에서 의도적으로 보호했습니다.
이제 App.vue의 새 코드로 이동해 보겠습니다.
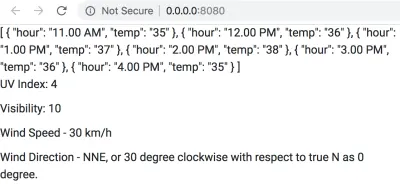
<template> <div> <dashboard-content :highlights="highlights" :tempVar="tempVar"></dashboard-content> </div> </template> <script> import Content from './components/Content.vue' export default { name: 'app', components: { 'dashboard-content': Content }, data () { return { tempVar: { tempToday: [ {hour: '11.00 AM', temp: '35'}, {hour: '12.00 PM', temp: '36'}, {hour: '1.00 PM', temp: '37'}, {hour: '2.00 PM', temp: '38'}, {hour: '3.00 PM', temp: '36'}, {hour: '4.00 PM', temp: '35'}, ], }, highlights: { uvIndex: 4, visibility: 10, windStatus: { windSpeed: '30 km/h', windDirection: '30', derivedWindDirection: 'NNE', }, }, } }, methods: { }, computed: { }, } </script> <style> </style>이전 버전과 관련된 코드의 변경 사항은 다음과 같습니다.
- 자식 컴포넌트의 이름이 대시보드 콘텐츠로 변경됨에 따라
<template>의 사용자 정의 HTML 요소가 수정되었습니다. 이제 이전에 사용자 정의 요소와 함께 사용한 단일 속성 대신에 두 개의 속성(highlights및tempVar)이 있음을 유의하십시오. 따라서 해당 속성과 관련된 데이터도 변경되었습니다. 여기서 흥미로운 점은 사용자 정의 HTML 요소의 여러 속성과 함께v-bind:지시문 또는 그 약어:여기서 수행한 것처럼)를 사용할 수 있다는 것입니다! -
data()함수는 이제 이전weather_data대신 두 개의 새 객체인tempVar및highlights와 함께filename객체(이전에 존재함)를 반환합니다. json의 구조는 자식 구성 요소에 작성한 코드에 적합하므로 덤프에서 필요한 데이터 조각을 추출할 수 있습니다. 구조는 매우 자명하며 라이브 데이터를 다룰 때 매우 유사할 것으로 예상할 수 있습니다. 그러나 직면하게 될 중요한 변경 사항은 하드코딩이 없다는 것입니다. 날씨 API.
이 섹션에서는 실제 출력을 보지 않고 많은 코드를 작성했습니다. 계속 진행하기 전에 브라우저를 살펴보고(필요한 경우 npm run dev 를 사용하여 서버를 다시 시작) 성취의 영광을 만끽하십시오. 이 시점에서 볼 웹 페이지는 아래 이미지와 같습니다.
데이터 수집 및 처리용 코드
이 섹션은 다음을 위해 App.vue 에 작성되는 모든 코드와 함께 프로젝트의 핵심이 될 것입니다.
- 사용자의 위치 입력 — 입력 상자와 클릭 유도문안 버튼으로 충분합니다.
- 다양한 작업을 위한 유틸리티 기능; 이러한 함수는 나중에 구성 요소 코드의 다양한 부분에서 호출됩니다.
- JavaScript용 Google Maps API에서 자세한 지리적 위치 데이터 가져오기
- Dark Sky API에서 자세한 날씨 데이터 가져오기
- 하위 구성 요소에 전달될 지리적 위치 및 날씨 데이터의 형식 지정 및 처리.
다음 하위 섹션은 위의 사항에서 우리를 위해 배치된 작업을 구현하는 방법을 보여줍니다. 일부 예외를 제외하고는 대부분이 순서를 따릅니다.
사용자의 입력
사용자가 날씨 데이터를 표시해야 하는 장소의 이름을 제공할 때 작업이 시작된다는 것은 매우 분명합니다. 이를 위해서는 다음을 구현해야 합니다.
- 위치를 입력하기 위한 입력 상자;
- 사용자가 위치를 입력했으며 나머지 작업을 수행할 시간임을 애플리케이션에 알리는 제출 버튼입니다. Enter 키를 누르면 처리가 시작될 때의 동작도 구현합니다.
아래에 표시되는 코드는 App.vue 의 HTML 템플릿 부분으로 제한됩니다. 클릭 이벤트와 관련된 메서드의 이름을 언급하고 나중에 App.vue에서 <script>의 메서드 개체에서 정의합니다.
<div> <input type="text" ref="input" placeholder="Location?" @keyup.enter="organizeAllDetails" > <button @click="organizeAllDetails"> <img src="./assets/Search.svg" width="24" height="24"> </button> </div>위의 스니펫을 올바른 위치에 배치하는 것은 간단합니다. 그러나 스니펫의 흥미로운 부분은 다음과 같습니다.
-
@keyup.enter="organizeAllDetails" -
@click="organizeAllDetails"
이전 섹션에서 알 수 있듯이 @ 는 일부 이벤트와 관련된 지시문 v-on :에 대한 Vue의 축약형입니다. 새로운 것은 " organizeAllDetails "입니다. 이벤트( Enter 키를 누르거나 버튼 클릭)가 발생하면 실행될 메서드일 뿐입니다. 아직 방법을 정의하지 않았으며 이 섹션이 끝날 때쯤 퍼즐이 완성될 것입니다.
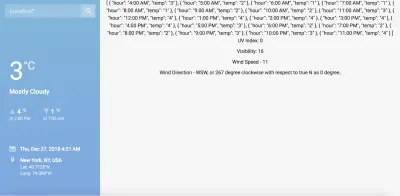
App.vue에서 제어하는 텍스트 정보 표시
사용자 입력이 작업을 트리거하고 API에서 많은 데이터를 수집하면 "이 모든 데이터를 어떻게 해야 합니까?"라는 피할 수 없는 질문에 직면하게 됩니다. 분명히 약간의 데이터 마사지가 필요하지만 이것이 우리 질문에 완전히 대답하지는 않습니다! 획득 및 처리된 데이터의 다른 청크를 수신하는 엔터티가 무엇인지 또는 더 직접적으로 데이터의 최종 용도를 결정해야 합니다.
계층 구조 및 목적에 따라 App.vue 의 하위 구성 요소는 대부분의 데이터에 대한 최전선 경쟁자입니다. 그러나 이러한 하위 구성 요소에 속하지 않지만 매우 유익하고 대시보드를 완성하는 일부 데이터도 있습니다. App.vue 에서 직접 제어하는 텍스트 정보로 표시하고 나머지 데이터는 자식에게 전달하여 궁극적으로 예쁜 차트로 표시하면 잘 사용할 수 있습니다.
이러한 맥락을 염두에 두고 텍스트 데이터를 사용하는 단계를 설정하기 위한 코드에 집중해보자. 이 시점에서 그것은 데이터가 결국에는 와서 앉게 될 단순한 HTML 템플릿입니다.
<div> <div class="wrapper-left"> <div> {{ currentWeather.temp }} <span>°C</span> </div> <div>{{ currentWeather.summary }}</div> <div class="temp-max-min"> <div class="max-desc"> <div> <i>▲</i> {{ currentWeather.todayHighLow.todayTempHigh }} <span>°C</span> </div> <div>at {{ currentWeather.todayHighLow.todayTempHighTime }}</div> </div> <div class="min-desc"> <div> <i>▼</i> {{ currentWeather.todayHighLow.todayTempLow }} <span>°C</span> </div> <div>at {{ currentWeather.todayHighLow.todayTempLowTime }}</div> </div> </div> </div> <div class="wrapper-right"> <div class="date-time-info"> <div> <img src="./assets/calendar.svg" width="20" height="20"> {{ currentWeather.time }} </div> </div> <div class="location-info"> <div> <img src="./assets/location.svg" width="10.83" height="15.83" > {{ currentWeather.full_location }} <div class="mt-1"> Lat: {{ currentWeather.formatted_lat }} <br> Long: {{ currentWeather.formatted_long }} </div> </div> </div> </div> </div>위 스니펫에서 다음을 이해해야 합니다.
-
{{ }}안의 내용 — 브라우저에서 렌더링되기 전에 HTML 템플릿에 동적 데이터를 삽입하는 Vue의 방법입니다. 당신은 전에 그들을 만났고, 새롭거나 놀라운 것은 없습니다. 이러한 데이터 객체는App.vue의export default()객체에 있는data()메서드에서 비롯된다는 점을 명심하십시오. 그들은 우리의 요구 사항에 따라 설정할 기본값을 가지고 있으며 실제 API 데이터로 개체를 채우는 특정 메서드를 작성합니다.
브라우저에 변경 사항이 표시되지 않는다고 걱정하지 마십시오. 데이터가 아직 정의되지 않았으며 Vue가 알지 못하는 것을 렌더링하지 않는 것은 당연합니다. 그러나 데이터가 설정되면 (지금은 데이터를 하드 코딩하여 확인할 수도 있음) 텍스트 데이터는 App.vue 에서 제어합니다.
data() 메서드
data() 메서드는 .vue 파일의 특수 구조입니다. 응용 프로그램에 매우 중요한 데이터 개체를 포함하고 반환합니다. 모든 .vue 파일에서 <script> 부분의 일반 구조를 기억하십시오. 대략 다음을 포함합니다.
<script> // import statements here export default { // name, components, props, etc. data() { return { // the data that is so crucial for the application is defined here. // the data objects will have certain default values chosen by us. // The methods that we define below will manipulate the data. // Since the data is bounded to various attributes and directives, they // will update as and when the values of the data objects change. } }, methods: { // methods (objects whose values are functions) here. // bulk of dynamic stuff (the black magic part) is controlled from here. }, computed: { // computed properties here }, // other objects, as necessary } </script> 지금까지 일부 데이터 개체의 이름을 접했지만 훨씬 더 많습니다. 대부분은 날씨 정보 덤프의 다른 측면을 처리하는 자식 구성 요소와 관련이 있습니다. 이 프로젝트에 필요한 전체 data() 메서드가 아래에 나와 있습니다. 객체의 명명법에 따라 API에서 기대하는 데이터와 데이터 배포 방법에 대한 공정한 아이디어를 얻을 수 있습니다.
data() { return { weatherDetails: false, location: '', // raw location from input lat: '', // raw latitude from google maps api response long: '', // raw longitude from google maps api response completeWeatherApi: '', // weather api string with lat and long rawWeatherData: '', // raw response from weather api currentWeather: { full_location: '', // for full address formatted_lat: '', // for N/S formatted_long: '', // for E/W time: '', temp: '', todayHighLow: { todayTempHigh: '', todayTempHighTime: '', todayTempLow: '', todayTempLowTime: '' }, summary: '', possibility: '' }, tempVar: { tempToday: [ // gets added dynamically by this.getSetHourlyTempInfoToday() ], }, highlights: { uvIndex: '', visibility: '', windStatus: { windSpeed: '', windDirection: '', derivedWindDirection: '' }, } }; },보시다시피, 대부분의 경우 기본값은 비어 있습니다. 이 시점에서 충분하기 때문입니다. 자식 구성 요소에 렌더링되거나 전달되기 전에 데이터를 조작하고 적절한 값으로 채우는 메서드가 작성됩니다.
App.vue의 메소드
.vue 파일의 경우 메서드는 일반적으로 methods { } 개체에 중첩된 키 값으로 작성됩니다. 주요 역할은 구성 요소의 데이터 개체를 조작하는 것입니다. 우리는 동일한 철학을 염두에 두고 App.vue 에 메소드를 작성할 것입니다. 그러나 목적에 따라 App.vue 의 메서드를 다음과 같이 분류할 수 있습니다.

- 유틸리티 방법
- 액션/이벤트 지향 방식
- 데이터 수집 방법
- 데이터 처리 방법
- 높은 수준의 접착제 방법
이것을 이해하는 것이 중요합니다. API가 어떻게 작동하는지, API가 제공하는 데이터 및 프로젝트에서 데이터를 어떻게 사용해야 하는지를 이미 파악했기 때문에 플래터에 메소드를 제시하고 있습니다. 우리가 방법을 아예 꺼내고 데이터를 처리하기 위해 일부 신비한 코드를 작성한 것이 아닙니다. 학습을 위해서는 메소드와 데이터에 대한 코드를 열심히 읽고 이해하는 것이 좋은 연습입니다. 그러나 처음부터 빌드해야 하는 새 프로젝트에 직면했을 때 모든 더러운 작업을 직접 해야 합니다. 즉, API를 데이터와 매끄럽게 연결하기 전에 프로그래밍 방식 액세스 및 데이터 구조와 같은 API를 많이 실험해야 합니다. 프로젝트가 요구하는 구조. 손을 댈 일도 없고 답답한 순간도 있겠지만 그게 모두 개발자로서 성숙해지는 과정의 일부입니다.
다음 하위 섹션에서는 각 메서드 유형에 대해 설명하고 해당 범주에 속하는 메서드의 구현도 보여줍니다. 메서드 이름은 목적에 대해 아주 자명합니다. 구현도 마찬가지이므로 따라하기가 충분히 쉬울 것입니다. 그러나 그 전에 .vue 파일에 메소드를 작성하는 일반적인 체계를 기억하십시오.
<script> // import statements here export default { // name, components, props, etc. data() { return { // the data that is so crucial for the application is defined here. } }, methods: { // methods (objects whose values are functions) here. // bulk of dynamic stuff (the black magic part) is controlled from here. method_1: function(arg_1) { }, method_2: function(arg_1, arg_2) { }, method_3: function(arg_1) { }, ……. }, computed: { // computed properties here }, // other objects, as necessary } </script>유틸리티 방법
유틸리티 메서드는 이름에서 알 수 있듯이 주로 부수적인 작업에 사용되는 반복적인 코드를 모듈화할 목적으로 작성된 메서드입니다. 필요할 때 다른 메서드에 의해 호출됩니다. 다음은 App.vue 에 대한 유틸리티 메서드입니다.
convertToTitleCase: function(str) { str = str.toLowerCase().split(' '); for (var i = 0; i < str.length; i++) { str[i] = str[i].charAt(0).toUpperCase() + str[i].slice(1); } return str.join(' '); }, // To format the “possibility” (of weather) string obtained from the weather API formatPossibility: function(str) { str = str.toLowerCase().split('-'); for (var i = 0; i < str.length; i++) { str[i] = str[i].charAt(0).toUpperCase() + str[i].slice(1); } return str.join(' '); }, // To convert Unix timestamps according to our convenience unixToHuman: function(timezone, timestamp) { /* READ THIS BEFORE JUDGING & DEBUGGING For any location beyond the arctic circle and the antarctic circle, the goddamn weather api does not return certain keys/values in each of this.rawWeatherData.daily.data[some_array_index]. Due to this, console throws up an error. The code is correct, the problem is with the API. May be later on I will add some padding to tackle missing values. */ var moment = require('moment-timezone'); // for handling date & time var decipher = new Date(timestamp * 1000); var human = moment(decipher) .tz(timezone) .format('llll'); var timeArray = human.split(' '); var timeNumeral = timeArray[4]; var timeSuffix = timeArray[5]; var justTime = timeNumeral + ' ' + timeSuffix; var monthDateArray = human.split(','); var monthDate = monthDateArray[1].trim(); return { fullTime: human, onlyTime: justTime, onlyMonthDate: monthDate }; }, // To convert temperature from fahrenheit to celcius fahToCel: function(tempInFahrenheit) { var tempInCelcius = Math.round((5 / 9) * (tempInFahrenheit — 32)); return tempInCelcius; }, // To convert the air pressure reading from millibar to kilopascal milibarToKiloPascal: function(pressureInMilibar) { var pressureInKPA = pressureInMilibar * 0.1; return Math.round(pressureInKPA); }, // To convert distance readings from miles to kilometers mileToKilometer: function(miles) { var kilometer = miles * 1.60934; return Math.round(kilometer); }, // To format the wind direction based on the angle deriveWindDir: function(windDir) { var wind_directions_array = [ { minVal: 0, maxVal: 30, direction: 'N' }, { minVal: 31, maxVal: 45, direction: 'NNE' }, { minVal: 46, maxVal: 75, direction: 'NE' }, { minVal: 76, maxVal: 90, direction: 'ENE' }, { minVal: 91, maxVal: 120, direction: 'E' }, { minVal: 121, maxVal: 135, direction: 'ESE' }, { minVal: 136, maxVal: 165, direction: 'SE' }, { minVal: 166, maxVal: 180, direction: 'SSE' }, { minVal: 181, maxVal: 210, direction: 'S' }, { minVal: 211, maxVal: 225, direction: 'SSW' }, { minVal: 226, maxVal: 255, direction: 'SW' }, { minVal: 256, maxVal: 270, direction: 'WSW' }, { minVal: 271, maxVal: 300, direction: 'W' }, { minVal: 301, maxVal: 315, direction: 'WNW' }, { minVal: 316, maxVal: 345, direction: 'NW' }, { minVal: 346, maxVal: 360, direction: 'NNW' } ]; var wind_direction = ''; for (var i = 0; i < wind_directions_array.length; i++) { if ( windDir >= wind_directions_array[i].minVal && windDir <= wind_directions_array[i].maxVal ) { wind_direction = wind_directions_array[i].direction; } } return wind_direction; }, 구현하지는 않았지만 .vue 파일에서 유틸리티 메서드를 가져와 별도의 JavaScript 파일에 넣을 수 있습니다. .vue 파일의 스크립트 부분 시작 부분에서 .js 파일을 가져오기만 하면 됩니다. 이러한 접근 방식은 특히 목적에 따라 더 잘 그룹화되는 많은 메서드를 사용할 수 있는 대규모 응용 프로그램에서 매우 잘 작동하고 코드를 깨끗하게 유지합니다. 이 방법을 이 문서에 나열된 모든 메서드 그룹에 적용하고 효과 자체를 확인할 수 있습니다. 그러나 여기에 제공된 과정을 수행한 후에는 해당 연습을 수행하여 완전히 동기화되어 작동하는 모든 부분에 대한 큰 그림을 이해하고 한 번 참조할 수 있는 작업 소프트웨어를 가질 것을 제안합니다. 실험 중 휴식.
액션/이벤트 지향 방법
이러한 메서드는 일반적으로 이벤트에 해당하는 작업을 수행해야 할 때 실행됩니다. 경우에 따라 이벤트는 사용자 상호 작용 또는 프로그래밍 방식으로 트리거될 수 있습니다. App.vue 파일에서 이러한 메서드는 유틸리티 메서드 아래에 있습니다.
makeInputEmpty: function() { this.$refs.input.value = ''; }, makeTempVarTodayEmpty: function() { this.tempVar.tempToday = []; }, detectEnterKeyPress: function() { var input = this.$refs.input; input.addEventListener('keyup', function(event) { event.preventDefault(); var enterKeyCode = 13; if (event.keyCode === enterKeyCode) { this.setHitEnterKeyTrue(); } }); }, locationEntered: function() { var input = this.$refs.input; if (input.value === '') { this.location = "New York"; } else { this.location = this.convertToTitleCase(input.value); } this.makeInputEmpty(); this.makeTempVarTodayEmpty(); }, 위의 코드 조각에서 흥미로운 점 중 하나는 $ref 의 사용입니다. 간단히 말해서, 코드를 포함하는 코드 문을 Vue가 영향을 미치는 HTML 구성에 연결하는 방법입니다(자세한 내용은 공식 가이드 참조). 예를 들어, makeInputEmpty() 및 detectEnterKeyPress() ) 메소드는 입력 상자에 영향을 줍니다. 왜냐하면 입력 상자의 HTML에서 ref 속성의 값을 input 으로 언급했기 때문입니다.
데이터 수집 방법
프로젝트에서 다음 두 API를 사용하고 있습니다.
- Google 지도 지오코더 API
이 API는 사용자가 검색한 위치의 좌표를 가져오기 위한 것입니다. API 키가 필요하며 주어진 링크의 문서를 따라 가면 얻을 수 있습니다. 현재로서는 FusionCharts에서 사용하는 API 키를 사용할 수 있지만 남용하지 마시고 자신의 키를 얻으시기 바랍니다. 이 프로젝트의 index.html에서 JavaScript API를 참조하고App.vue파일의 코드에 대해 이 API에서 제공하는 생성자를 사용할 것입니다. - 어두운 하늘 날씨 API
이 API는 좌표에 해당하는 날씨 데이터를 가져오기 위한 것입니다. 그러나 우리는 그것을 직접 사용하지 않을 것입니다. FusionCharts의 서버 중 하나를 통해 리디렉션되는 URL로 래핑합니다. 그 이유는 우리와 같은 완전한 클라이언트 측 애플리케이션에서 API로 GET 요청을 보내면 실망스러운CORS오류가 발생하기 때문입니다(자세한 정보는 여기 및 여기).
중요 참고 사항 : Google Maps 및 Dark Sky API를 사용했기 때문에 이 두 API에는 이 문서에서 공유한 고유한 API 키가 있습니다. 이렇게 하면 백엔드 구현의 골칫거리가 아닌 클라이언트 측 개발에 집중하는 데 도움이 됩니다. 그러나 API 키에는 제한이 있으며 이러한 제한을 초과하면 응용 프로그램을 직접 시도할 수 없으므로 고유한 키를 만드는 것이 좋습니다 .
Google 지도의 경우 이 문서로 이동하여 API 키를 받으세요. Dark Sky API의 경우 https://darksky.net/dev를 방문하여 API 키와 해당 엔드포인트를 생성하십시오.
컨텍스트를 염두에 두고 프로젝트에 대한 데이터 수집 방법의 구현을 살펴보겠습니다.
getCoordinates: function() { this.locationEntered(); var loc = this.location; var coords; var geocoder = new google.maps.Geocoder(); return new Promise(function(resolve, reject) { geocoder.geocode({ address: loc }, function(results, status) { if (status == google.maps.GeocoderStatus.OK) { this.lat = results[0].geometry.location.lat(); this.long = results[0].geometry.location.lng(); this.full_location = results[0].formatted_address; coords = { lat: this.lat, long: this.long, full_location: this.full_location }; resolve(coords); } else { alert("Oops! Couldn't get data for the location"); } }); }); }, /* The coordinates that Google Maps Geocoder API returns are way too accurate for our requirements. We need to bring it into shape before passing the coordinates on to the weather API. Although this is a data processing method in its own right, we can't help mentioning it right now, because the data acquisition method for the weather API has dependency on the output of this method. */ setFormatCoordinates: async function() { var coordinates = await this.getCoordinates(); this.lat = coordinates.lat; this.long = coordinates.long; this.currentWeather.full_location = coordinates.full_location; // Remember to beautify lat for N/S if (coordinates.lat > 0) { this.currentWeather.formatted_lat = (Math.round(coordinates.lat * 10000) / 10000).toString() + '°N'; } else if (coordinates.lat < 0) { this.currentWeather.formatted_lat = (-1 * (Math.round(coordinates.lat * 10000) / 10000)).toString() + '°S'; } else { this.currentWeather.formatted_lat = ( Math.round(coordinates.lat * 10000) / 10000 ).toString(); } // Remember to beautify long for N/S if (coordinates.long > 0) { this.currentWeather.formatted_long = (Math.round(coordinates.long * 10000) / 10000).toString() + '°E'; } else if (coordinates.long < 0) { this.currentWeather.formatted_long = (-1 * (Math.round(coordinates.long * 10000) / 10000)).toString() + '°W'; } else { this.currentWeather.formatted_long = ( Math.round(coordinates.long * 10000) / 10000 ).toString(); } }, /* This method dynamically creates the the correct weather API query URL, based on the formatted latitude and longitude. The complete URL is then fed to the method querying for weather data. Notice that the base URL used in this method (without the coordinates) points towards a FusionCharts server — we must redirect our GET request to the weather API through a server to avoid the CORS error. */ fixWeatherApi: async function() { await this.setFormatCoordinates(); var weatherApi = 'https://csm.fusioncharts.com/files/assets/wb/wb-data.php?src=darksky&lat=' + this.lat + '&long=' + this.long; this.completeWeatherApi = weatherApi; }, fetchWeatherData: async function() { await this.fixWeatherApi(); var axios = require('axios'); // for handling weather api promise var weatherApiResponse = await axios.get(this.completeWeatherApi); if (weatherApiResponse.status === 200) { this.rawWeatherData = weatherApiResponse.data; } else { alert('Hmm... Seems like our weather experts are busy!'); } },Through these methods, we have introduced the concept of async-await in our code. If you have been a JavaScript developer for some time now, you must be familiar with the callback hell, which is a direct consequence of the asynchronous way JavaScript is written. ES6 allows us to bypass the cumbersome nested callbacks, and our code becomes much cleaner if we write JavaScript in a synchronous way, using the async-await technique. However, there is a downside. It takes away the speed that asynchronous code gives us, especially for the portions of the code that deals with data being exchanged over the internet. Since this is not a mission-critical application with low latency requirements, and our primary aim is to learn stuff, the clean code is much more preferable over the slightly fast code.
Data Processing Methods
Now that we have the methods that will bring the data to us, we need to prepare the ground for properly receiving and processing the data. Safety nets must be cast, and there should be no spills — data is the new gold (OK, that might be an exaggeration in our context)! Enough with the fuss, let's get to the point.
Technically, the methods we implement in this section are aimed at getting the data out of the acquisition methods and the data objects in App.vue , and sometimes setting the data objects to certain values that suits the purpose.
getTimezone: function() { return this.rawWeatherData.timezone; }, getSetCurrentTime: function() { var currentTime = this.rawWeatherData.currently.time; var timezone = this.getTimezone(); this.currentWeather.time = this.unixToHuman( timezone, currentTime ).fullTime; }, getSetSummary: function() { var currentSummary = this.convertToTitleCase( this.rawWeatherData.currently.summary ); if (currentSummary.includes(' And')) { currentSummary = currentSummary.replace(' And', ','); } this.currentWeather.summary = currentSummary; }, getSetPossibility: function() { var possible = this.formatPossibility(this.rawWeatherData.daily.icon); if (possible.includes(' And')) { possible = possible.replace(' And', ','); } this.currentWeather.possibility = possible; }, getSetCurrentTemp: function() { var currentTemp = this.rawWeatherData.currently.temperature; this.currentWeather.temp = this.fahToCel(currentTemp); }, getTodayDetails: function() { return this.rawWeatherData.daily.data[0]; }, getSetTodayTempHighLowWithTime: function() { var timezone = this.getTimezone(); var todayDetails = this.getTodayDetails(); this.currentWeather.todayHighLow.todayTempHigh = this.fahToCel( todayDetails.temperatureMax ); this.currentWeather.todayHighLow.todayTempHighTime = this.unixToHuman( timezone, todayDetails.temperatureMaxTime ).onlyTime; this.currentWeather.todayHighLow.todayTempLow = this.fahToCel( todayDetails.temperatureMin ); this.currentWeather.todayHighLow.todayTempLowTime = this.unixToHuman( timezone, todayDetails.temperatureMinTime ).onlyTime; }, getHourlyInfoToday: function() { return this.rawWeatherData.hourly.data; }, getSetHourlyTempInfoToday: function() { var unixTime = this.rawWeatherData.currently.time; var timezone = this.getTimezone(); var todayMonthDate = this.unixToHuman(timezone, unixTime).onlyMonthDate; var hourlyData = this.getHourlyInfoToday(); for (var i = 0; i < hourlyData.length; i++) { var hourlyTimeAllTypes = this.unixToHuman(timezone, hourlyData[i].time); var hourlyOnlyTime = hourlyTimeAllTypes.onlyTime; var hourlyMonthDate = hourlyTimeAllTypes.onlyMonthDate; if (todayMonthDate === hourlyMonthDate) { var hourlyObject = { hour: '', temp: '' }; hourlyObject.hour = hourlyOnlyTime; hourlyObject.temp = this.fahToCel(hourlyData[i].temperature).toString(); this.tempVar.tempToday.push(hourlyObject); /* Since we are using array.push(), we are just adding elements at the end of the array. Thus, the array is not getting emptied first when a new location is entered. to solve this problem, a method this.makeTempVarTodayEmpty() has been created, and called from this.locationEntered(). */ } } /* To cover the edge case where the local time is between 10 — 12 PM, and therefore there are only two elements in the array this.tempVar.tempToday. We need to add the points for minimum temperature and maximum temperature so that the chart gets generated with atleast four points. */ if (this.tempVar.tempToday.length <= 2) { var minTempObject = { hour: this.currentWeather.todayHighLow.todayTempHighTime, temp: this.currentWeather.todayHighLow.todayTempHigh }; var maxTempObject = { hour: this.currentWeather.todayHighLow.todayTempLowTime, temp: this.currentWeather.todayHighLow.todayTempLow }; /* Typically, lowest temp are at dawn, highest temp is around mid day. Thus we can safely arrange like min, max, temp after 10 PM. */ // array.unshift() adds stuff at the beginning of the array. // the order will be: min, max, 10 PM, 11 PM. this.tempVar.tempToday.unshift(maxTempObject, minTempObject); } }, getSetUVIndex: function() { var uvIndex = this.rawWeatherData.currently.uvIndex; this.highlights.uvIndex = uvIndex; }, getSetVisibility: function() { var visibilityInMiles = this.rawWeatherData.currently.visibility; this.highlights.visibility = this.mileToKilometer(visibilityInMiles); }, getSetWindStatus: function() { var windSpeedInMiles = this.rawWeatherData.currently.windSpeed; this.highlights.windStatus.windSpeed = this.mileToKilometer( windSpeedInMiles ); var absoluteWindDir = this.rawWeatherData.currently.windBearing; this.highlights.windStatus.windDirection = absoluteWindDir; this.highlights.windStatus.derivedWindDirection = this.deriveWindDir( absoluteWindDir ); },높은 수준의 접착제 방법
유용성, 획득 및 처리 방법을 제쳐두고 이제 전체를 조정하는 작업이 남았습니다. 전체 작업이 원활하게 실행되도록 기본적으로 특정 순서로 위에 작성된 메서드를 호출하는 높은 수준의 글루 메서드를 만들어 이를 수행합니다.
// Top level for info section // Data in this.currentWeather organizeCurrentWeatherInfo: function() { // data in this.currentWeather /* Coordinates and location is covered (get & set) in: — this.getCoordinates() — this.setFormatCoordinates() There are lots of async-await involved there. So it's better to keep them there. */ this.getSetCurrentTime(); this.getSetCurrentTemp(); this.getSetTodayTempHighLowWithTime(); this.getSetSummary(); this.getSetPossibility(); }, // Top level for highlights organizeTodayHighlights: function() { // top level for highlights this.getSetUVIndex(); this.getSetVisibility(); this.getSetWindStatus(); }, // Top level organization and rendering organizeAllDetails: async function() { // top level organization await this.fetchWeatherData(); this.organizeCurrentWeatherInfo(); this.organizeTodayHighlights(); this.getSetHourlyTempInfoToday(); },탑재
Vue는 기본적으로 메서드인 속성인 인스턴스 수명 주기 후크를 제공하며 인스턴스 수명 주기가 해당 단계에 도달하면 트리거됩니다. 예를 들어, Created, Mounted, beforeUpdate 등은 모두 프로그래머가 그렇지 않은 경우보다 훨씬 더 세분화된 수준에서 인스턴스를 제어할 수 있게 해주는 매우 유용한 수명 주기 후크입니다.
Vue 구성 요소의 코드에서 이러한 수명 주기 후크는 다른 prop 에서와 마찬가지로 구현됩니다. 예를 들어:
<template> </template> <script> // import statements export default { data() { return { // data objects here } }, methods: { // methods here }, mounted: function(){ // function body here }, } </script> <style> </style> 이 새로운 이해로 무장하고 App.vue 의 mounted 소품에 대한 아래 코드를 살펴보십시오.
mounted: async function() { this.location = "New York"; await this.organizeAllDetails(); }App.vue의 전체 코드
우리는 이 섹션에서 많은 부분을 다루었고 마지막 몇 섹션에서는 부분적으로 모든 것을 제공했습니다. 그러나 App.vue 에 대해 완전하고 어셈블된 코드가 있는 것이 중요합니다(이후 섹션에서 추가로 수정될 수 있음). 여기 간다:
<template> <div> <div class="container-fluid"> <div class="row"> <div class="col-md-3 col-sm-4 col-xs-12 sidebar"> <div> <input type="text" ref="input" placeholder="Location?" @keyup.enter="organizeAllDetails" > <button @click="organizeAllDetails"> <img src="./assets/Search.svg" width="24" height="24"> </button> </div> <div> <div class="wrapper-left"> <div> {{ currentWeather.temp }} <span>°C</span> </div> <div>{{ currentWeather.summary }}</div> <div class="temp-max-min"> <div class="max-desc"> <div> <i>▲</i> {{ currentWeather.todayHighLow.todayTempHigh }} <span>°C</span> </div> <div>at {{ currentWeather.todayHighLow.todayTempHighTime }}</div> </div> <div class="min-desc"> <div> <i>▼</i> {{ currentWeather.todayHighLow.todayTempLow }} <span>°C</span> </div> <div>at {{ currentWeather.todayHighLow.todayTempLowTime }}</div> </div> </div> </div> <div class="wrapper-right"> <div class="date-time-info"> <div> <img src="./assets/calendar.svg" width="20" height="20"> {{ currentWeather.time }} </div> </div> <div class="location-info"> <div> <img src="./assets/location.svg" width="10.83" height="15.83" > {{ currentWeather.full_location }} <div class="mt-1"> Lat: {{ currentWeather.formatted_lat }} <br> Long: {{ currentWeather.formatted_long }} </div> </div> </div> </div> </div> </div> <dashboard-content class="col-md-9 col-sm-8 col-xs-12 content" :highlights="highlights" :tempVar="tempVar" ></dashboard-content> </div> </div> </div> </template> <script> import Content from './components/Content.vue'; export default { name: 'app', props: [], components: { 'dashboard-content': Content }, data() { return { weatherDetails: false, location: '', // raw location from input lat: '', // raw latitude from google maps api response long: '', // raw longitude from google maps api response completeWeatherApi: '', // weather api string with lat and long rawWeatherData: '', // raw response from weather api currentWeather: { full_location: '', // for full address formatted_lat: '', // for N/S formatted_long: '', // for E/W time: '', temp: '', todayHighLow: { todayTempHigh: '', todayTempHighTime: '', todayTempLow: '', todayTempLowTime: '' }, summary: '', possibility: '' }, tempVar: { tempToday: [ // gets added dynamically by this.getSetHourlyTempInfoToday() ], }, highlights: { uvIndex: '', visibility: '', windStatus: { windSpeed: '', windDirection: '', derivedWindDirection: '' }, } }; }, methods: { // Some utility functions convertToTitleCase: function(str) { str = str.toLowerCase().split(' '); for (var i = 0; i < str.length; i++) { str[i] = str[i].charAt(0).toUpperCase() + str[i].slice(1); } return str.join(' '); }, formatPossibility: function(str) { str = str.toLowerCase().split('-'); for (var i = 0; i < str.length; i++) { str[i] = str[i].charAt(0).toUpperCase() + str[i].slice(1); } return str.join(' '); }, unixToHuman: function(timezone, timestamp) { /* READ THIS BEFORE JUDGING & DEBUGGING For any location beyond the arctic circle and the antarctic circle, the goddamn weather api does not return certain keys/values in each of this.rawWeatherData.daily.data[some_array_index]. Due to this, console throws up an error. The code is correct, the problem is with the API. May be later on I will add some padding to tackle missing values. */ var moment = require('moment-timezone'); // for handling date & time var decipher = new Date(timestamp * 1000); var human = moment(decipher) .tz(timezone) .format('llll'); var timeArray = human.split(' '); var timeNumeral = timeArray[4]; var timeSuffix = timeArray[5]; var justTime = timeNumeral + ' ' + timeSuffix; var monthDateArray = human.split(','); var monthDate = monthDateArray[1].trim(); return { fullTime: human, onlyTime: justTime, onlyMonthDate: monthDate }; }, fahToCel: function(tempInFahrenheit) { var tempInCelcius = Math.round((5 / 9) * (tempInFahrenheit — 32)); return tempInCelcius; }, milibarToKiloPascal: function(pressureInMilibar) { var pressureInKPA = pressureInMilibar * 0.1; return Math.round(pressureInKPA); }, mileToKilometer: function(miles) { var kilometer = miles * 1.60934; return Math.round(kilometer); }, deriveWindDir: function(windDir) { var wind_directions_array = [ { minVal: 0, maxVal: 30, direction: 'N' }, { minVal: 31, maxVal: 45, direction: 'NNE' }, { minVal: 46, maxVal: 75, direction: 'NE' }, { minVal: 76, maxVal: 90, direction: 'ENE' }, { minVal: 91, maxVal: 120, direction: 'E' }, { minVal: 121, maxVal: 135, direction: 'ESE' }, { minVal: 136, maxVal: 165, direction: 'SE' }, { minVal: 166, maxVal: 180, direction: 'SSE' }, { minVal: 181, maxVal: 210, direction: 'S' }, { minVal: 211, maxVal: 225, direction: 'SSW' }, { minVal: 226, maxVal: 255, direction: 'SW' }, { minVal: 256, maxVal: 270, direction: 'WSW' }, { minVal: 271, maxVal: 300, direction: 'W' }, { minVal: 301, maxVal: 315, direction: 'WNW' }, { minVal: 316, maxVal: 345, direction: 'NW' }, { minVal: 346, maxVal: 360, direction: 'NNW' } ]; var wind_direction = ''; for (var i = 0; i < wind_directions_array.length; i++) { if ( windDir >= wind_directions_array[i].minVal && windDir <= wind_directions_array[i].maxVal ) { wind_direction = wind_directions_array[i].direction; } } return wind_direction; }, // Some basic action oriented functions makeInputEmpty: function() { this.$refs.input.value = ''; }, makeTempVarTodayEmpty: function() { this.tempVar.tempToday = []; }, detectEnterKeyPress: function() { var input = this.$refs.input; input.addEventListener('keyup', function(event) { event.preventDefault(); var enterKeyCode = 13; if (event.keyCode === enterKeyCode) { this.setHitEnterKeyTrue(); } }); }, locationEntered: function() { var input = this.$refs.input; if (input.value === '') { this.location = "New York"; } else { this.location = this.convertToTitleCase(input.value); } this.makeInputEmpty(); this.makeTempVarTodayEmpty(); }, getCoordinates: function() { this.locationEntered(); var loc = this.location; var coords; var geocoder = new google.maps.Geocoder(); return new Promise(function(resolve, reject) { geocoder.geocode({ address: loc }, function(results, status) { if (status == google.maps.GeocoderStatus.OK) { this.lat = results[0].geometry.location.lat(); this.long = results[0].geometry.location.lng(); this.full_location = results[0].formatted_address; coords = { lat: this.lat, long: this.long, full_location: this.full_location }; resolve(coords); } else { alert("Oops! Couldn't get data for the location"); } }); }); }, // Some basic asynchronous functions setFormatCoordinates: async function() { var coordinates = await this.getCoordinates(); this.lat = coordinates.lat; this.long = coordinates.long; this.currentWeather.full_location = coordinates.full_location; // Remember to beautify lat for N/S if (coordinates.lat > 0) { this.currentWeather.formatted_lat = (Math.round(coordinates.lat * 10000) / 10000).toString() + '°N'; } else if (coordinates.lat < 0) { this.currentWeather.formatted_lat = (-1 * (Math.round(coordinates.lat * 10000) / 10000)).toString() + '°S'; } else { this.currentWeather.formatted_lat = ( Math.round(coordinates.lat * 10000) / 10000 ).toString(); } // Remember to beautify long for N/S if (coordinates.long > 0) { this.currentWeather.formatted_long = (Math.round(coordinates.long * 10000) / 10000).toString() + '°E'; } else if (coordinates.long < 0) { this.currentWeather.formatted_long = (-1 * (Math.round(coordinates.long * 10000) / 10000)).toString() + '°W'; } else { this.currentWeather.formatted_long = ( Math.round(coordinates.long * 10000) / 10000 ).toString(); } }, fixWeatherApi: async function() { await this.setFormatCoordinates(); var weatherApi = 'https://csm.fusioncharts.com/files/assets/wb/wb-data.php?src=darksky&lat=' + this.lat + '&long=' + this.long; this.completeWeatherApi = weatherApi; }, fetchWeatherData: async function() { await this.fixWeatherApi(); var axios = require('axios'); // for handling weather api promise var weatherApiResponse = await axios.get(this.completeWeatherApi); if (weatherApiResponse.status === 200) { this.rawWeatherData = weatherApiResponse.data; } else { alert('Hmm... Seems like our weather experts are busy!'); } }, // Get and set functions; often combined, because they are short // For basic info — left panel/sidebar getTimezone: function() { return this.rawWeatherData.timezone; }, getSetCurrentTime: function() { var currentTime = this.rawWeatherData.currently.time; var timezone = this.getTimezone(); this.currentWeather.time = this.unixToHuman( timezone, currentTime ).fullTime; }, getSetSummary: function() { var currentSummary = this.convertToTitleCase( this.rawWeatherData.currently.summary ); if (currentSummary.includes(' And')) { currentSummary = currentSummary.replace(' And', ','); } this.currentWeather.summary = currentSummary; }, getSetPossibility: function() { var possible = this.formatPossibility(this.rawWeatherData.daily.icon); if (possible.includes(' And')) { possible = possible.replace(' And', ','); } this.currentWeather.possibility = possible; }, getSetCurrentTemp: function() { var currentTemp = this.rawWeatherData.currently.temperature; this.currentWeather.temp = this.fahToCel(currentTemp); }, getTodayDetails: function() { return this.rawWeatherData.daily.data[0]; }, getSetTodayTempHighLowWithTime: function() { var timezone = this.getTimezone(); var todayDetails = this.getTodayDetails(); this.currentWeather.todayHighLow.todayTempHigh = this.fahToCel( todayDetails.temperatureMax ); this.currentWeather.todayHighLow.todayTempHighTime = this.unixToHuman( timezone, todayDetails.temperatureMaxTime ).onlyTime; this.currentWeather.todayHighLow.todayTempLow = this.fahToCel( todayDetails.temperatureMin ); this.currentWeather.todayHighLow.todayTempLowTime = this.unixToHuman( timezone, todayDetails.temperatureMinTime ).onlyTime; }, getHourlyInfoToday: function() { return this.rawWeatherData.hourly.data; }, getSetHourlyTempInfoToday: function() { var unixTime = this.rawWeatherData.currently.time; var timezone = this.getTimezone(); var todayMonthDate = this.unixToHuman(timezone, unixTime).onlyMonthDate; var hourlyData = this.getHourlyInfoToday(); for (var i = 0; i < hourlyData.length; i++) { var hourlyTimeAllTypes = this.unixToHuman(timezone, hourlyData[i].time); var hourlyOnlyTime = hourlyTimeAllTypes.onlyTime; var hourlyMonthDate = hourlyTimeAllTypes.onlyMonthDate; if (todayMonthDate === hourlyMonthDate) { var hourlyObject = { hour: '', temp: '' }; hourlyObject.hour = hourlyOnlyTime; hourlyObject.temp = this.fahToCel(hourlyData[i].temperature).toString(); this.tempVar.tempToday.push(hourlyObject); /* Since we are using array.push(), we are just adding elements at the end of the array. Thus, the array is not getting emptied first when a new location is entered. to solve this problem, a method this.makeTempVarTodayEmpty() has been created, and called from this.locationEntered(). */ } } /* To cover the edge case where the local time is between 10 — 12 PM, and therefore there are only two elements in the array this.tempVar.tempToday. We need to add the points for minimum temperature and maximum temperature so that the chart gets generated with atleast four points. */ if (this.tempVar.tempToday.length <= 2) { var minTempObject = { hour: this.currentWeather.todayHighLow.todayTempHighTime, temp: this.currentWeather.todayHighLow.todayTempHigh }; var maxTempObject = { hour: this.currentWeather.todayHighLow.todayTempLowTime, temp: this.currentWeather.todayHighLow.todayTempLow }; /* Typically, lowest temp are at dawn, highest temp is around mid day. Thus we can safely arrange like min, max, temp after 10 PM. */ // array.unshift() adds stuff at the beginning of the array. // the order will be: min, max, 10 PM, 11 PM. this.tempVar.tempToday.unshift(maxTempObject, minTempObject); } }, // For Today Highlights getSetUVIndex: function() { var uvIndex = this.rawWeatherData.currently.uvIndex; this.highlights.uvIndex = uvIndex; }, getSetVisibility: function() { var visibilityInMiles = this.rawWeatherData.currently.visibility; this.highlights.visibility = this.mileToKilometer(visibilityInMiles); }, getSetWindStatus: function() { var windSpeedInMiles = this.rawWeatherData.currently.windSpeed; this.highlights.windStatus.windSpeed = this.mileToKilometer( windSpeedInMiles ); var absoluteWindDir = this.rawWeatherData.currently.windBearing; this.highlights.windStatus.windDirection = absoluteWindDir; this.highlights.windStatus.derivedWindDirection = this.deriveWindDir( absoluteWindDir ); }, // top level for info section organizeCurrentWeatherInfo: function() { // data in this.currentWeather /* Coordinates and location is covered (get & set) in: — this.getCoordinates() — this.setFormatCoordinates() There are lots of async-await involved there. So it's better to keep them there. */ this.getSetCurrentTime(); this.getSetCurrentTemp(); this.getSetTodayTempHighLowWithTime(); this.getSetSummary(); this.getSetPossibility(); }, organizeTodayHighlights: function() { // top level for highlights this.getSetUVIndex(); this.getSetVisibility(); this.getSetWindStatus(); }, // topmost level orchestration organizeAllDetails: async function() { // top level organization await this.fetchWeatherData(); this.organizeCurrentWeatherInfo(); this.organizeTodayHighlights(); this.getSetHourlyTempInfoToday(); }, }, mounted: async function() { this.location = "New York"; await this.organizeAllDetails(); } }; </script>그리고 마침내 많은 인내와 노력 끝에 데이터 흐름을 원시적인 힘으로 볼 수 있습니다! 브라우저에서 애플리케이션을 방문하고 페이지를 새로고침하고 애플리케이션의 검색 상자에서 위치를 검색하고 Enter 키를 누르 십시오 !
이제 모든 무거운 작업을 마쳤으므로 휴식을 취하십시오. 다음 섹션에서는 데이터를 사용하여 아름답고 유익한 차트를 만드는 데 초점을 맞춘 다음 CSS를 사용하여 보기 흉한 애플리케이션에 훨씬 가치 있는 정리 세션을 제공합니다.
5. FusionCharts를 사용한 데이터 시각화
차트에 대한 기본 고려 사항
최종 사용자에게 대시보드의 본질은 본질적으로 다음과 같습니다. 특정 주제에 대해 필터링되고 신중하게 선별된 정보의 모음으로, 빠른 수집을 위해 시각/그래픽 도구를 통해 전달됩니다. 그들은 데이터 파이프라인 엔지니어링의 미묘함이나 코드가 얼마나 미적인지 신경 쓰지 않습니다. 원하는 것은 3초 만에 높은 수준의 보기입니다. 따라서 텍스트 데이터를 표시하는 조잡한 애플리케이션은 그들에게 아무 의미가 없으며 데이터를 차트로 래핑하는 메커니즘을 구현할 때입니다.
그러나 차트 구현에 대해 자세히 알아보기 전에 몇 가지 관련 질문과 우리의 관점에서 가능한 답변을 고려해 보겠습니다.
- 우리가 다루고 있는 데이터 유형에 적합한 차트 유형은 무엇입니까?
글쎄요, 답에는 두 가지 측면이 있습니다. 컨텍스트와 목적입니다. 컨텍스트란 데이터 유형을 의미하며 프로젝트의 범위와 대상에 따라 더 큰 계획에 전반적으로 적합합니다. 그리고 의도적으로, 우리는 본질적으로 "우리가 강조하고 싶은 것은 무엇입니까?"를 의미합니다. 예를 들어, 기둥형 차트(열이 나타내는 값에 높이가 비례하는 동일한 너비의 수직 기둥)를 사용하여 하루 중 다른 시간에 오늘의 온도를 나타낼 수 있습니다. 그러나 개별 값에는 거의 관심이 없고 데이터 전체의 전반적인 변동 및 추세에 관심이 있습니다. 목적에 맞게 꺾은선형 차트를 사용하는 것이 가장 좋으며 곧 그렇게 할 것입니다. - 차트 라이브러리를 선택하기 전에 염두에 두어야 할 사항은 무엇입니까?
우리는 주로 JavaScript 기반 기술을 사용하여 프로젝트를 수행하고 있기 때문에 프로젝트를 위해 선택한 차트 라이브러리는 JavaScript 세계의 기본 라이브러리여야 합니다. 이러한 기본 전제를 염두에 두고 특정 라이브러리를 0으로 만들기 전에 다음을 고려해야 합니다.- 우리가 선택한 프레임워크 지원 (이 경우 Vue.js). 프로젝트는 React 또는 Angular와 같은 다른 인기 있는 JavaScript 프레임워크에서 개발할 수 있습니다. 선호하는 프레임워크에 대한 차트 라이브러리 지원을 확인하세요. 또한 Python, Java, C++, .Net(AS 및 VB)과 같은 다른 인기 있는 프로그래밍 언어에 대한 지원도 고려해야 합니다.
- 차트 유형 및 기능의 가용성 프로젝트에서 데이터의 최종 형태와 목적이 무엇인지 미리 아는 것은 거의 불가능하기 때문에(특히 요구 사항이 전문적인 환경에서 고객에 의해 규제되는 경우). 이 경우 전체 범위를 확장하고 가장 광범위한 차트 모음이 있는 차트 라이브러리를 선택해야 합니다. 더 중요한 것은 다른 프로젝트와 차별화하기 위해 라이브러리에 구성 가능한 차트 속성의 형태로 충분한 기능이 있어야 차트의 대부분의 측면과 적절한 수준의 세분성을 미세 조정하고 사용자 지정할 수 있다는 것입니다. 또한 기본 차트 구성은 합리적이어야 하며 라이브러리 문서는 최고 수준이어야 합니다. 이는 전문 개발자에게 명백한 이유입니다.
- 특히 데이터 시각화를 처음 접하는 경우 학습 곡선, 지원 커뮤니티 및 균형 도 고려해야 합니다. 스펙트럼의 한쪽 끝에는 비용이 많이 들고 학습 곡선이 원활하지만 사용자 지정 가능성, 통합 및 배포 측면에서 많은 제한이 있는 Tableau 및 Qlickview와 같은 독점 도구가 있습니다. 다른 쪽 끝에는 d3.js가 있습니다. 방대하고 무료이며(오픈 소스) 핵심에 맞게 사용자 지정할 수 있지만 라이브러리로 생산적인 모든 작업을 수행하려면 매우 가파른 학습 곡선의 대가를 지불해야 합니다.
당신에게 필요한 것은 생산성, 적용 범위, 사용자 정의 가능성, 학습 곡선, 그리고 비용 사이의 올바른 균형인 최적의 지점입니다. 웹 및 모바일을 위한 세계에서 가장 포괄적이고 엔터프라이즈급 JavaScript 차트 작성 라이브러리인 FusionCharts를 살펴보시기 바랍니다. 이 라이브러리는 차트 작성을 위해 이 프로젝트에서 사용할 것입니다.
FusionChart 소개
FusionCharts는 전 세계 수백 개국에 흩어져 있는 수백만 개발자가 사용하는 JavaScript 차트 라이브러리로 전 세계적으로 사용됩니다. 기술적으로, 웹 기반 프로젝트에 사용되는 거의 모든 대중적인 기술 스택과의 통합을 지원하여 로드 및 구성이 가능한 한 가능합니다. FusionCharts를 상업적으로 사용하려면 라이선스가 필요하며 사용 사례에 따라 라이선스 비용을 지불해야 합니다(궁금한 경우 영업팀에 문의). 그러나 우리는 이 프로젝트에서 FusionCharts를 사용하여 몇 가지를 시도할 뿐이므로 라이선스가 없는 버전(차트에 작은 워터마크 및 기타 몇 가지 제한이 있음)을 사용합니다. 라이센스가 없는 버전을 사용하는 것은 차트를 시험해보고 비상업적 또는 개인 프로젝트에서 사용할 때 완벽하게 괜찮습니다. 응용 프로그램을 상업적으로 배포할 계획이 있는 경우 FusionCharts의 라이선스가 있는지 확인하십시오.
이것은 Vue.js와 관련된 프로젝트이므로 이전에 설치하지 않은 경우 설치해야 하는 두 개의 모듈이 필요합니다.
-
fusioncharts모듈, 차트 생성에 필요한 모든 것이 포함되어 있기 때문입니다. - Vue.js 프로젝트에서 사용할 수 있도록 본질적으로 fusioncharts용 래퍼인
vue-fusioncharts모듈
이전에 설치하지 않은 경우(세 번째 섹션의 지침에 따라) 프로젝트의 루트 디렉터리에서 다음 명령을 실행하여 설치합니다.
npm install fusioncharts vue-fusioncharts --save 다음으로, 프로젝트의 src/main.js 파일에 다음 코드가 있는지 확인하십시오(섹션 3에서도 언급됨).
import Vue from 'vue'; import App from './App.vue'; import FusionCharts from 'fusioncharts'; import Charts from 'fusioncharts/fusioncharts.charts'; import Widgets from 'fusioncharts/fusioncharts.widgets'; import PowerCharts from 'fusioncharts/fusioncharts.powercharts'; import FusionTheme from 'fusioncharts/themes/fusioncharts.theme.fusion'; import VueFusionCharts from 'vue-fusioncharts'; Charts(FusionCharts); PowerCharts(FusionCharts); Widgets(FusionCharts); FusionTheme(FusionCharts); Vue.use(VueFusionCharts, FusionCharts); new Vue({ el: '#app', render: h => h(App) })아마도 위의 스니펫에서 가장 중요한 줄은 다음과 같습니다.
Vue.use(VueFusionCharts, FusionCharts)이것은 분명히 우리가 명시적으로 정의하지 않았지만 모듈 자체에 정의된 프로젝트의 많은 것들을 이해하기 위해 vue-fusioncharts 모듈을 사용하도록 Vue에 지시합니다. 또한 이 유형의 명령문은 전역 선언을 의미합니다. 즉, Vue가 프로젝트 코드에서 이상한 것을 발견하는 곳(FusionChart 사용에 대해 명시적으로 정의하지 않은 것)이 있는 곳이면 어디에서나 vue-fusioncharts에서 최소한 한 번은 볼 것입니다. 오류를 던지기 전에 정의를 위한 fusioncharts 노드 모듈. 프로젝트의 격리된 부분에서 FusionCharts를 사용했다면(거의 모든 구성 요소 파일에서 사용하지 않음) 로컬 선언이 더 합리적이었을 것입니다.
이것으로 프로젝트에서 FusionCharts를 사용하도록 설정되었습니다. 우리는 시각화하려는 날씨 데이터의 측면에 따라 매우 다양한 차트를 사용할 것입니다. 또한 데이터 바인딩, 사용자 지정 구성 요소 및 감시자의 상호 작용이 작동하는 것을 보게 될 것입니다.
.vue 파일에서 Fusioncharts를 사용하기 위한 일반 체계
이 섹션에서는 .vue 파일에서 다양한 차트를 생성하기 위해 FusionCharts를 사용하는 일반적인 아이디어를 설명합니다. 하지만 먼저 핵심 아이디어를 도식적으로 보여주는 의사 코드를 살펴보겠습니다.
<template> <div> <fusioncharts :attribute_1="data_object_1" :attribute_2="data_object_2" … … ... > </fusioncharts> </div> </template> <script> export default { props: ["data_prop_received_by_the_component"], components: {}, data() { return { data_object_1: "value_1", data_object_2: "value_2", … … }; }, methods: {}, computed: {}, watch: { data_prop_received_by_the_component: { handler: function() { // some code/logic, mainly data manipulation based }, deep: true } } }; </script> <style> // component specific special CSS code here </style>위 의사 코드의 다른 부분을 이해합시다.
-
<template>에서 최상위 수준<div>내(모든 구성 요소의 템플릿 HTML 코드에 거의 필수임)에는 사용자 지정 구성 요소<fusioncharts>가 있습니다. 이 프로젝트를 위해 설치한vue-fusioncharts노드 모듈에 포함된 구성 요소의 정의가 있습니다. 내부적으로vue-fusioncharts는 역시 설치된fusioncharts모듈에 의존합니다. 필요한 모듈을 가져오고 종속성을 해결하고 Vue가src/main.js파일에서 래퍼를 전역적으로(프로젝트 전체에서) 사용하도록 지시했습니다. 따라서 우리가 사용한 사용자 정의<fusioncharts>구성 요소에 대한 정의가 부족하지 않습니다. 여기. 또한 사용자 정의 구성 요소에는 사용자 정의 속성이 있으며 각 사용자 정의 속성은v-bind지시문에 의해 데이터 개체(및 해당 값)에 바인딩됩니다. 여기서 약어는 콜론(:기호입니다. 이 프로젝트에 사용된 특정 차트에 대해 논의할 때 속성 및 관련 데이터 개체에 대해 더 자세히 알아볼 것입니다. -
<script>에서 먼저 구성 요소가 수신해야 하는 props를 선언한 다음 계속해서<fusioncharts>의 속성에 묶인 데이터 개체를 정의합니다. 데이터 개체에 할당된 값은<fusioncharts>의 속성이 가져온 값이며, 가져온 값을 기준으로 차트가 생성됩니다. 이 외에도 코드에서 가장 흥미로운 부분은watch { }객체입니다. 이것은 Vue의 사물 체계에서 매우 특별한 객체입니다. 본질적으로 Vue가 특정 데이터에 발생하는 모든 변경 사항을 감시하고 해당 데이터에 대한handler기능이 정의된 방식에 따라 조치를 취하도록 지시합니다. 예를 들어, 우리는 Vue가 수신된prop, 즉 의사 코드에서data_prop_received_by_the_component에 대한 감시를 유지하기를 원합니다.prop은watch { }객체의 키가 되고 키 값은 또 다른 객체입니다. 이 객체는prop이 변경될 때마다 수행해야 하는 작업을 설명하는 핸들러 메서드입니다. 변경 사항을 처리하는 이러한 우아한 메커니즘을 통해 앱은 반응성을 유지합니다.deep: true는 감시자와 연결할 수 있는 부울 플래그를 나타냅니다. 따라서 감시 중인 개체가 더 자세히 관찰됩니다. 즉, 개체의 중첩 수준에서 이루어진 변경 사항도 추적됩니다.
( 감시자에 대한 자세한 내용은 공식 문서를 참조하십시오 .)
이제 일반적인 체계를 이해했으므로 .vue 구성 요소 파일에 있는 차트의 특정 구현에 대해 알아보겠습니다. 코드는 꽤 자명할 것이며, 위에서 설명한 것들의 일반적인 체계에 구체적인 내용이 어떻게 들어맞는지 이해하려고 노력해야 합니다.
.vue 파일의 차트 구현
구현의 세부 사항은 차트마다 다르지만 모든 차트에 다음 설명이 적용됩니다.
-
<template>
앞에서 설명한 것처럼<fusioncharts>사용자 지정 구성 요소에는v-bind: 지시문을 사용하여data()함수에 정의된 해당 데이터 개체에 각각 바인딩되는 여러 속성이 있습니다. 속성 이름은 그 의미에 대해 아주 자명하며 해당 데이터 개체를 파악하는 것도 간단합니다. -
<script>
data()함수에서 데이터 개체와 해당 값은<fusioncharts>의 속성에 사용되는v-bind(:) 지시문에 의해 수행되는 바인딩으로 인해 차트가 작동하도록 합니다. 개별 데이터 개체에 대해 자세히 알아보기 전에 몇 가지 일반적인 특성을 언급할 가치가 있습니다.- 값이
0또는1인 데이터 개체는 본질적으로 부울입니다. 여기서0은 사용할 수 없는/꺼진 항목을 나타내고1은 가용성/켜진 상태를 나타냅니다. 그러나 부울이 아닌 데이터 개체는 다른 가능한 값 외에 값으로0또는1을 가질 수도 있습니다. 이는 컨텍스트에 따라 다릅니다. 예를 들어, 기본값이0인containerbackgroundopacity는 부울인 반면, 기본값이0인lowerLimit은 단순히 숫자 0이 리터럴 값임을 의미합니다. - 일부 데이터 객체는 여백, 패딩, 글꼴 크기 등과 같은 CSS 속성을 처리합니다. 값에는 "px" 또는 픽셀의 암시적 단위가 있습니다. 마찬가지로, 다른 데이터 개체는 해당 값과 연결된 암시적 단위를 가질 수 있습니다. 자세한 내용은 FusionCharts Dev Center의 해당 차트 속성 페이지를 참조하십시오.
- 값이
-
data()함수에서 아마도 가장 흥미롭고 명확하지 않은 객체는 dataSource일 것입니다. 이 개체에는 세 가지 주요 개체가 중첩되어 있습니다.- chart : 이 개체는 차트의 구성 및 외관과 관련된 많은 차트 속성을 캡슐화합니다. 이 프로젝트를 위해 만들 모든 차트에서 찾을 수 있는 거의 필수 구성 요소입니다.
- colorrange : 이 개체는 고려 중인 차트에 다소 고유하며 차트에서 사용되는 스케일의 다양한 하위 범위를 구분하기 위해 여러 색상/음영을 처리하는 차트에 주로 나타납니다.
- 값: 이 개체는 척도 범위에서 강조 표시되어야 하는 특정 값이 있는 차트에 다시 나타납니다.
-
watch { }객체는 아마도 이 차트와 이 프로젝트에 사용된 다른 차트를 생기있게 만드는 가장 중요한 요소일 것입니다. 차트의 반응성, 즉 새 사용자 쿼리로 인한 새 값을 기반으로 자체적으로 업데이트되는 차트는 이 개체에 정의된 감시자에 의해 제어됩니다. 예를 들어 구성 요소에서 수신한 소품highlights에 대한 감시자를 정의한 다음 전체 프로젝트에서 감시 중인 개체에 대해 변경 사항이 있을 때 취해야 하는 필요한 조치에 대해 Vue에 지시하는 핸들러 함수를 정의했습니다. 즉,App.vue가highlights내의 모든 개체에 대해 새 값을 생성할 때마다 정보가 이 구성 요소로 흘러내리고 이 구성 요소의 데이터 개체에서 새 값이 업데이트됩니다. 값에 바인딩된 차트도 이 메커니즘의 결과로 업데이트됩니다.
위의 설명은 더 큰 그림에 대한 직관적인 이해를 개발하는 데 도움이 되는 매우 광범위한 스트로크입니다. 개념을 직관적으로 이해하면 코드 자체에서 명확하지 않은 것이 있을 때 항상 Vue.js 및 FusionCharts 문서를 참조할 수 있습니다. 연습은 여러분에게 맡기고 다음 하위 섹션부터는 이 하위 섹션에서 다룬 내용을 설명하지 않습니다.
src/components/TempVarChart.vue
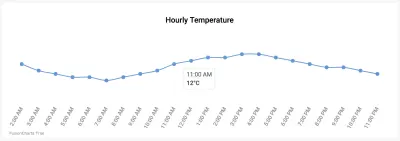
<template> <div class="custom-card header-card card"> <div class="card-body pt-0"> <fusioncharts type="spline" width="100%" height="100%" dataformat="json" dataEmptyMessage="i-https://i.postimg.cc/R0QCk9vV/Rolling-0-9s-99px.gif" dataEmptyMessageImageScale=39 :datasource="tempChartData" > </fusioncharts> </div> </div> </template> <script> export default { props: ["tempVar"], components: {}, data() { return { tempChartData: { chart: { caption: "Hourly Temperature", captionFontBold: "0", captionFontColor: "#000000", captionPadding: "30", baseFont: "Roboto", chartTopMargin: "30", showHoverEffect: "1", theme: "fusion", showaxislines: "1", numberSuffix: "°C", anchorBgColor: "#6297d9", paletteColors: "#6297d9", drawCrossLine: "1", plotToolText: "$label<br><hr><b>$dataValue</b>", showAxisLines: "0", showYAxisValues: "0", anchorRadius: "4", divLineAlpha: "0", labelFontSize: "13", labelAlpha: "65", labelFontBold: "0", rotateLabels: "1", slantLabels: "1", canvasPadding: "20" }, data: [], }, }; }, methods: { setChartData: function() { var data = []; for (var i = 0; i < this.tempVar.tempToday.length; i++) { var dataObject = { label: this.tempVar.tempToday[i].hour, value: this.tempVar.tempToday[i].temp }; data.push(dataObject); } this.tempChartData.data = data; }, }, mounted: function() { this.setChartData(); }, watch: { tempVar: { handler: function() { this.setChartData(); }, deep: true }, }, }; </script> <style> </style>src/components/UVIndex.vue
이 구성 요소에는 매우 유용한 차트인 Angular Gauge가 포함되어 있습니다.
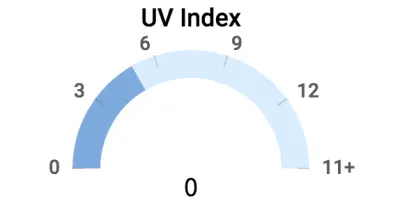
구성 요소에 대한 코드는 아래에 나와 있습니다. Angular Gauge의 차트 속성에 대한 자세한 내용은 Angular Gauge에 대한 FusionCharts Dev Center 페이지를 참조하십시오.
<template> <div class="highlights-item col-md-4 col-sm-6 col-xs-12 border-top"> <div> <fusioncharts :type="type" :width="width" :height="height" :containerbackgroundopacity="containerbackgroundopacity" :dataformat="dataformat" :datasource="datasource" ></fusioncharts> </div> </div> </template> <script> export default { props: ["highlights"], components: {}, data() { return { type: "angulargauge", width: "100%", height: "100%", containerbackgroundopacity: 0, dataformat: "json", datasource: { chart: { caption: "UV Index", captionFontBold: "0", captionFontColor: "#000000", captionPadding: "30", lowerLimit: "0", upperLimit: "15", lowerLimitDisplay: "1", upperLimitDisplay: "1", showValue: "0", theme: "fusion", baseFont: "Roboto", bgAlpha: "0", canvasbgAlpha: "0", gaugeInnerRadius: "75", gaugeOuterRadius: "110", pivotRadius: "0", pivotFillAlpha: "0", valueFontSize: "20", valueFontColor: "#000000", valueFontBold: "1", tickValueDistance: "3", autoAlignTickValues: "1", majorTMAlpha: "20", chartTopMargin: "30", chartBottomMargin: "40" }, colorrange: { color: [ { minvalue: "0", maxvalue: this.highlights.uvIndex.toString(), code: "#7DA9E0" }, { minvalue: this.highlights.uvIndex.toString(), maxvalue: "15", code: "#D8EDFF" } ] }, annotations: { groups: [ { items: [ { id: "val-label", type: "text", text: this.highlights.uvIndex.toString(), fontSize: "20", font: "Source Sans Pro", fontBold: "1", fillcolor: "#212529", x: "$gaugeCenterX", y: "$gaugeCenterY" } ] } ] }, dials: { dial: [ { value: this.highlights.uvIndex.toString(), baseWidth: "0", radius: "0", borderThickness: "0", baseRadius: "0" } ] } } }; }, methods: {}, computed: {}, watch: { highlights: { handler: function() { this.datasource.colorrange.color[0].maxvalue = this.highlights.uvIndex.toString(); this.datasource.colorrange.color[1].minvalue = this.highlights.uvIndex.toString(); this.datasource.annotations.groups[0].items[0].text = this.highlights.uvIndex.toString(); }, deep: true } } }; </script>src/components/Visibility.vue
이 구성 요소에서 수평 선형 게이지를 사용하여 아래 이미지와 같이 가시성을 나타냅니다.
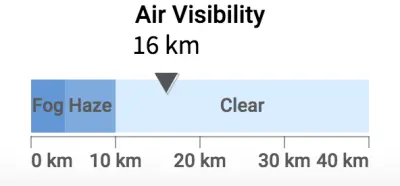
구성 요소에 대한 코드는 아래에 나와 있습니다. 이 차트 유형의 다양한 속성에 대한 심층적인 이해는 수평 선형 게이지에 대한 FusionCharts 개발자 센터 페이지를 참조하십시오.
<template> <div class="highlights-item col-md-4 col-sm-6 col-xs-12 border-left border-right border-top"> <div> <fusioncharts :type="type" :width="width" :height="height" :containerbackgroundopacity="containerbackgroundopacity" :dataformat="dataformat" :datasource="datasource" > </fusioncharts> </div> </div> </template> <script> export default { props: ["highlights"], components: {}, methods: {}, computed: {}, data() { return { type: "hlineargauge", width: "100%", height: "100%", containerbackgroundopacity: 0, dataformat: "json", creditLabel: false, datasource: { chart: { caption: "Air Visibility", captionFontBold: "0", captionFontColor: "#000000", baseFont: "Roboto", numberSuffix: " km", lowerLimit: "0", upperLimit: "40", showPointerShadow: "1", animation: "1", transposeAnimation: "1", theme: "fusion", bgAlpha: "0", canvasBgAlpha: "0", valueFontSize: "20", valueFontColor: "#000000", valueFontBold: "1", pointerBorderAlpha: "0", chartBottomMargin: "40", captionPadding: "30", chartTopMargin: "30" }, colorRange: { color: [ { minValue: "0", maxValue: "4", label: "Fog", code: "#6297d9" }, { minValue: "4", maxValue: "10", label: "Haze", code: "#7DA9E0" }, { minValue: "10", maxValue: "40", label: "Clear", code: "#D8EDFF" } ] }, pointers: { pointer: [ { value: this.highlights.visibility.toString() } ] } } }; }, watch: { highlights: { handler: function() { this.datasource.pointers.pointer[0].value = this.highlights.visibility.toString(); }, deep: true } } }; </script>src/components/WindStatus.vue
이 컴포넌트는 풍속과 풍향(물리적 지식이 있는 경우 풍속)을 표시하는데 차트를 사용하여 벡터를 표현하는 것은 매우 어렵습니다. 이러한 경우에는 멋진 이미지와 텍스트 값을 사용하여 표시하는 것이 좋습니다. 우리가 생각한 표현은 전적으로 CSS에 의존하므로 CSS를 다루는 다음 섹션에서 구현합니다. 그러나 우리가 만들고자 하는 것을 살펴보십시오.
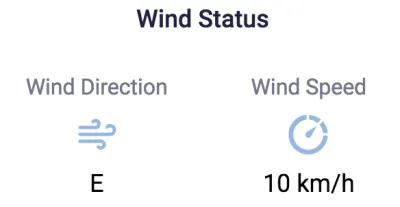
<template> <div class="highlights-item col-md-4 col-sm-6 col-xs-12 border-top"> <div> <div class="card-heading pt-5">Wind Status</div> <div class="row pt-4 mt-4"> <div class="col-sm-6 col-md-6 mt-2 text-center align-middle"> <p class="card-sub-heading mt-3">Wind Direction</p> <p class="mt-4"><img src="../assets/winddirection.svg" height="40" width="40"></p> <p class="card-value mt-4">{{ highlights.windStatus.derivedWindDirection }}</p> </div> <div class="col-sm-6 col-md-6 mt-2"> <p class="card-sub-heading mt-3">Wind Speed</p> <p class="mt-4"><img src="../assets/windspeed.svg" height="40" width="40"></p> <p class="card-value mt-4">{{ highlights.windStatus.windSpeed }} km/h</p> </div> </div> </div> </div> </template> <script> export default { props: ["highlights"], components: {}, data() { return {}; }, methods: {}, computed: {} }; </script>Highlights.vue로 마무리
Content.vue 및 Highlights.vue 를 제외한 모든 구성 요소에 대해 CSS로 코드를 이미 구현했음을 기억하십시오. Content.vue 는 데이터를 중계하는 단순한 구성 요소이기 때문에 필요한 최소한의 스타일 지정은 이미 다뤘습니다. 또한 사이드바와 차트가 포함된 카드의 스타일을 지정하기 위한 적절한 코드를 이미 작성했습니다. 따라서 우리가 할 일은 주로 CSS 클래스를 사용하는 것과 관련된 Highlights.vue 에 약간의 스타일 비트를 추가하는 것입니다.
<template> <div class="custom-content-card content-card card"> <div class="card-body pb-0"> <div class="content-header h4 text-center pt-2 pb-3">Highlights</div> <div class="row"> <uv-index :highlights="highlights"></uv-index> <visibility :highlights="highlights"></visibility> <wind-status :highlights="highlights"></wind-status> </div> </div> </div> </template> <script> import UVIndex from "./UVIndex.vue"; import Visibility from "./Visibility.vue"; import WindStatus from "./WindStatus.vue"; export default { props: ["highlights"], components: { "uv-index": UVIndex, "visibility": Visibility, "wind-status": WindStatus, }, }; </script>배포 및 소스 코드
차트와 스타일을 정리하면 끝! 잠시 시간을 내어 작품의 아름다움을 감상하세요.
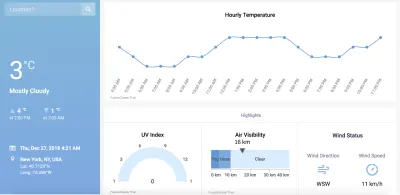
이제 애플리케이션을 배포하고 동료와 공유할 차례입니다. 배포에 대한 정보가 많지 않고 도움이 될 것으로 예상되는 경우 여기에서 배포 아이디어에 대해 살펴보십시오. 링크된 기사에는 모든 차트의 왼쪽 하단에 있는 FusionCharts 워터마크를 제거하는 방법에 대한 제안도 포함되어 있습니다.
어딘가 엉망이고 참조 지점이 필요한 경우 Github에서 소스 코드를 사용할 수 있습니다.